
Target validation: does a gene drive a phenotype
Test a hypothesis that one gene drives one phenotype, such as RAC2 regulates the production of interleukin-2, against evidence tables that score every gene. Each table is one falsification test; the tests are combined as POPPER combines them, and the result says whether the hypothesis survives and how unusual the gene's evidence is among all genes.
| Reached by | Tools → Analyze |
| Formats | One gene-level table per test: a gene and its score on each line, with a header line |
What it does
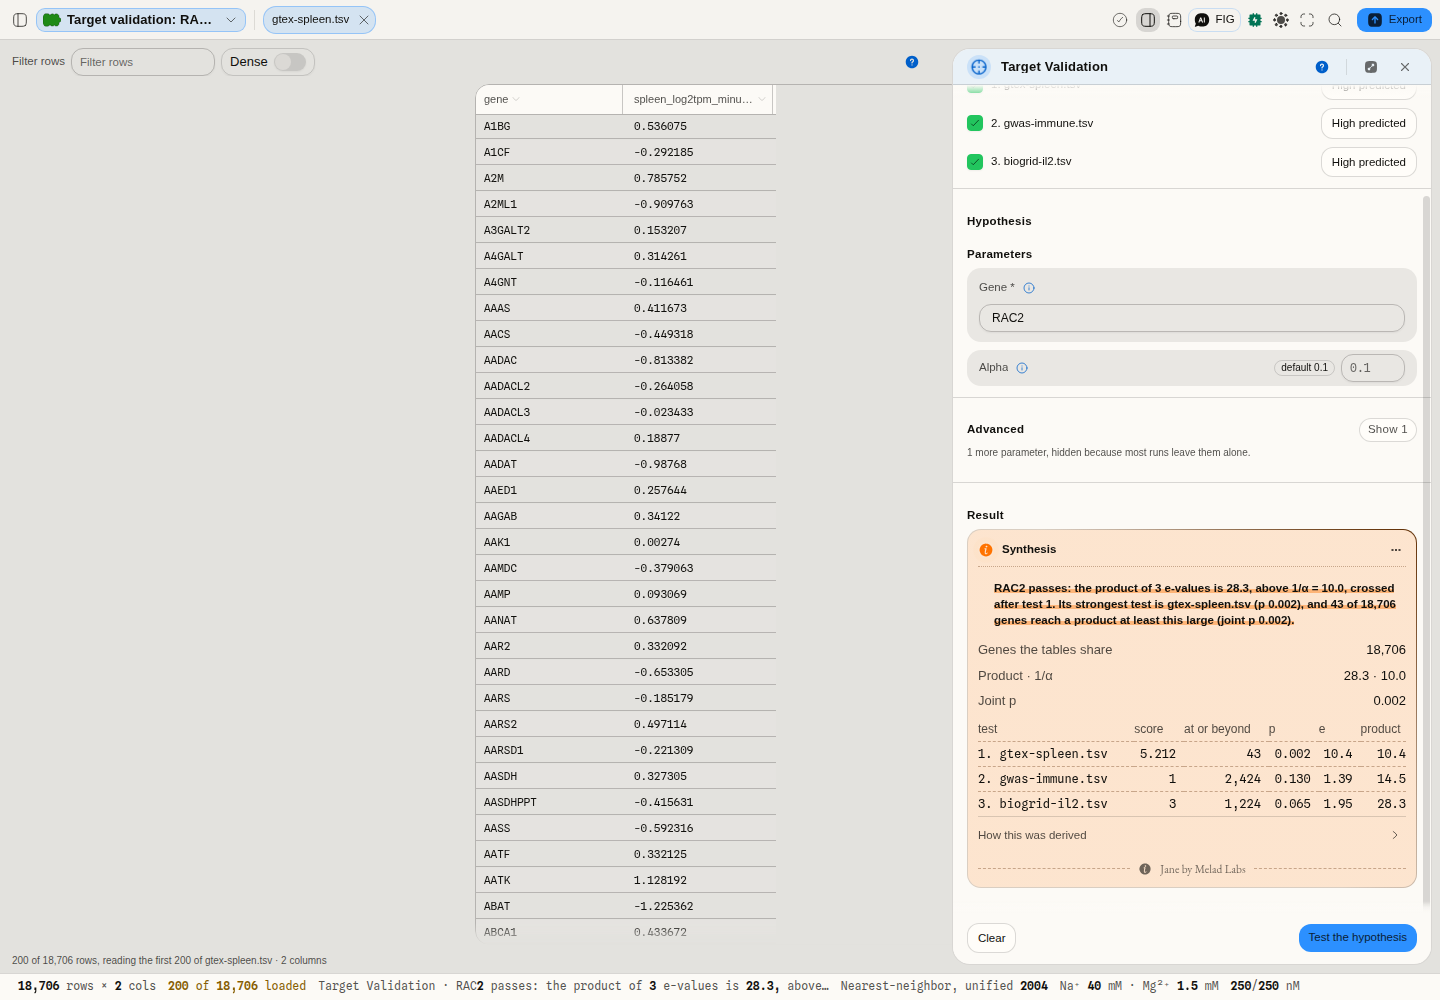
Choose the evidence tables in the order the tests should apply, name the gene, and set α. For each table you say which end of the score the hypothesis predicts (high by default). The result gives, per test, the gene's score, how many genes score at or beyond it, its p, its e-value and the running product; whether the product exceeds 1/α and after which test it first did; and the joint p.
When you'd use this
- Before committing to a target: check that a screen hit is also expressed where the phenotype lives, tied to related disease by genetics, and connected to the process's known genes.
- Ranking candidate genes from a screen by how much independent evidence supports each.
- Pre-registering tests: the tables and their order are fixed before the gene's evidence is read, so adding tests later cannot inflate the error rate.
What this computes
- each test's p: the share of genes scoring at or beyond the gene, the gene itself included, under the null that the gene is exchangeable with any other gene the tables score (ties count against the gene, so the p is conservative)
- each test's e-value, by the Vovk–Wang calibrator κ·p^(κ−1) (κ = 0.5 by default, as POPPER uses)
- the running product of the e-values in the order given, and the decision: the hypothesis passes when the product exceeds 1/α, strictly, as POPPER decides
- the test after which the product first crossed 1/α
- the joint p: the share of genes whose own product is at least the gene's. The product is an e-value only when the tests are independent under the null; the joint p is valid whatever the dependence between the tables
Every result states in words generated from the run whether the gene passes, its strongest test, the joint p, when the product and the joint p disagree and why, and any test that gives the gene p = 1 because it has no evidence there.
Worked example
The starter tests RAC2 regulates IL-2 production with three tables over the 18,706 genes the primary human T-cell CRISPR screens of POPPER's TargetVal benchmark covered:
- Spleen expression: log2(1 + median TPM in spleen) minus the gene's mean over GTEx v8's 54 tissues.
- Immune GWAS: the number of GWAS Catalog studies associating the gene with an immune system disorder at p ≤ 5 × 10⁻⁸.
- IL-2 partners: the number of the gene's BioGRID physical partners annotated in GO to IL-2 production, the gene itself excluded.
RAC2 ranks 43rd of 18,706 in spleen (p 0.0023, e 10.4), which crosses 1/α = 10 at α = 0.1 on its own. The other two tests take the product to 28.3, and 43 genes reach a product that large (joint p 0.0023). CD2 falls just short: its product is 9.52, while its joint p of 0.009 would call it.
Across the benchmark, this fixed battery passes 4 of the 20 strongest IL-2 hits by the product and 15 by the joint p (5 and 25 of the 50 strongest). On tables permuted as the benchmark builds its negatives it passes 0.5% of genes, and on the real tables it passes 0.8% of the genes the screen scored in its bottom half by the product, 9.2% by the joint p. POPPER, whose tests an agent designs from 22 tables, reports 58% power at a Type-I error of 0.082.
Limitations
- The battery is yours to choose. The tests should be implications of the hypothesis chosen before reading the gene's evidence; picking tables after seeing where the gene ranks is the p-hacking the e-values cannot undo.
- A gene with no evidence in a table gets p = 1, which halves the product. Sparse tables such as GWAS counts penalise genes nobody has studied.
- Correlated tables. A well-studied gene scores high everywhere. Read the joint p when the product and it disagree.
- Not a causal test. Passing means the gene's evidence is unusual among genes in the predicted direction, not that it regulates the phenotype.
Provenance
POPPER's sequential falsification and its e-value calibrator (Huang et al., ICML 2025); the benchmark's ground truth from POPPER's TargetVal. Evidence from GTEx v8, the GWAS Catalog with EFO's immune system disorder branch, BioGRID and the Gene Ontology through QuickGO.