
Virtual Gel Bench
Marked experimental: the surface can change.
Render fragments as bands on an agarose gel before running the real one.
| Reached by | Tools → Virtual Gel Bench |
| Sample project | Virtual gel bench |
What it does
The bench is a gel with no tool attached to it. Every other gel in the workbench belongs to the operation that produced it — the digest's gel shows that digest, the PCR gel shows that amplicon — but a real gel is a place where you put several different things side by side, and that is what this is.
A lane here is a name, a list of fragment lengths, and a DNA form. Where the lengths came from is up to you: the open molecule, a list of sizes you type or paste, or a hand-off from Restriction Digest, PCR or Ligation. All the lanes are placed on one shared coordinate system, so bands in different lanes are directly comparable — which is the entire reason anyone runs samples on the same gel.
That last point is also the catch, and this bench is explicit about it. A gel has one casting percentage, so every lane you put on it is read under this gel's conditions, not the ones it was computed at somewhere else. A lane handed over from another panel therefore carries the conditions it was read at: when this bench is empty it adopts them, so the band you chose a percentage to resolve stays resolved; when it already holds lanes it keeps its own and tells you which lane is being re-read and at what. Sizes always come from the gel you are looking at.
A gel has one agarose percentage, and every lane on it is placed at that percentage — including a lane handed over from a tool that computed it at another. So the hand-off states which happened. If the bench is empty when the lanes arrive, it takes the sending run's percentage and mobility law, because nothing already on the plate was read at a different one; if the bench already holds lanes, it keeps its own and the reading names the conditions the arriving lane was read at, so you know that a size you read off it is a size on this gel rather than the one it came from. Cast a different percentage at any time and the same statement follows the lanes.
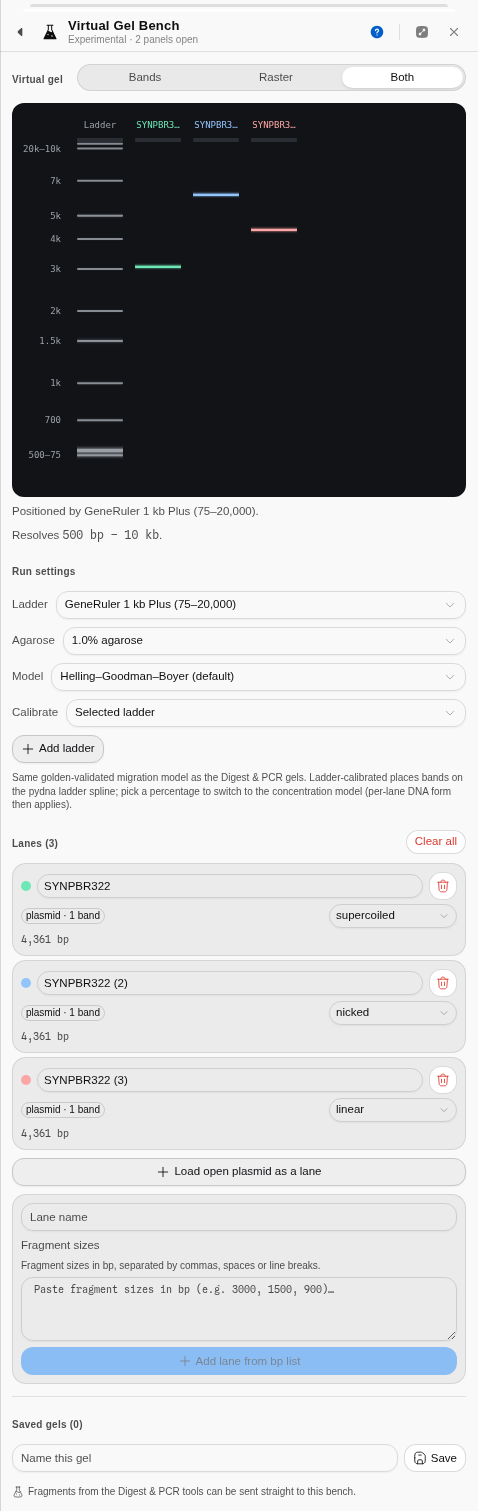
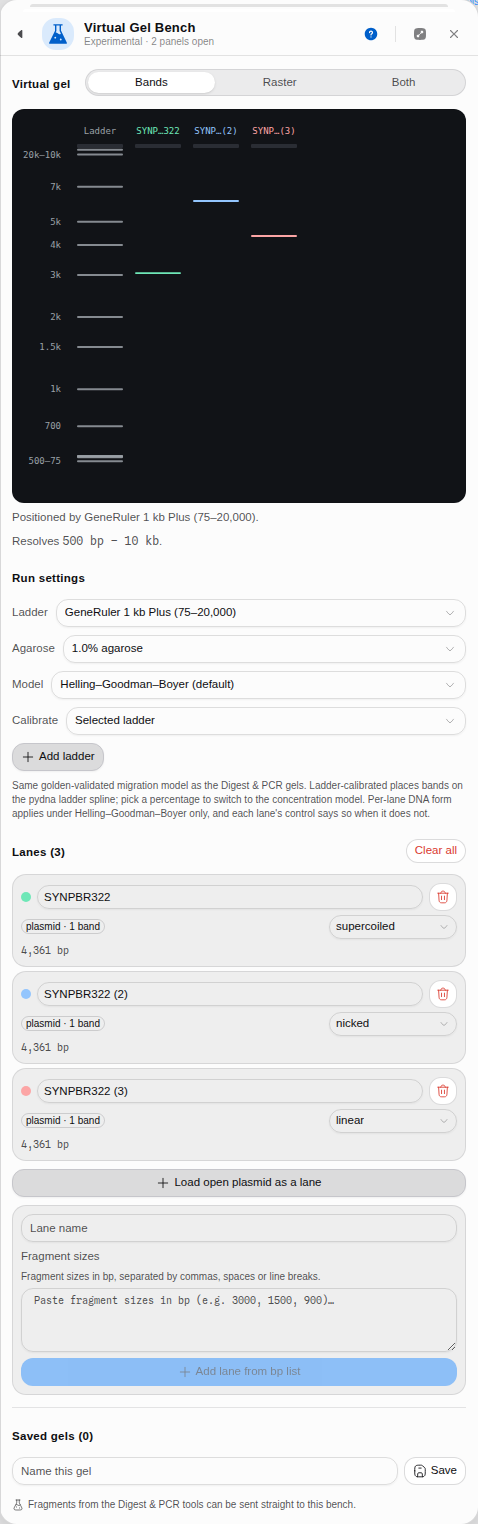 The same 4,361 bp plasmid in three lanes — supercoiled, nicked and linear. Nothing about the
molecule's length differs; only its shape does, and that alone moves it most of a gel. This is why a
"pure" plasmid prep shows more than one band, and why reading a size off an uncut plasmid is a
mistake.
When you'd use this
Used in: Clone an insert into a vector, and prove it worked · Design primers, simulate the PCR, and predict the band
- Planning the gel you are about to pour. Put your marker, your uncut control and two or three candidate digests in adjacent lanes and see whether the bands you need to tell apart are actually separated at the percentage you were going to use. This is a five-second check that routinely saves an hour.
- Choosing the percentage. Set an agarose percentage and the bench states the window that gel resolves. If your diagnostic band is outside it, you are about to run the wrong gel.
- Comparing what you got with what you expected. Type the sizes you measured off your real gel photo into one lane, put the predicted digest beside it, and look at the two together.
- Uncut versus cut. A supercoiled plasmid, the same plasmid nicked, and its linearised form run at three different apparent sizes despite being the same molecule. Give each lane its own form and the bench shows you that, which is what makes an unexpected band interpretable.
What this computes
Where a band lands, on one shared coordinate system, so lanes are comparable — which is the entire reason anyone runs samples on the same gel.
-
Migration per fragment, from either of two published models: Helling–Goodman–Boyer (the default) or Rill/Van Winkle. Which one ran, and at what agarose percentage, is stated with the gel
-
Ladder-calibrated placement as the default — bands placed by interpolation on the ladder's own measured
(bp, Rf)curve, with no concentration term at all. Choosing a casting percentage switches to the concentration model, and each of the ten offered percentages tells you the size window it resolves -
A custom percentage from 0.3% to 5% for the gel you actually poured. Under Rill/Van Winkle that is a genuinely different gel anywhere inside the 0.5–1.3% it was measured over; under Helling–Goodman–Boyer the panel names which of the ten anchors your figure was modelled at rather than implying a precision the law does not have
-
DNA form per lane — linear, supercoiled, nicked or relaxed — because one gel routinely carries more than one topology, and topology alone moves a band most of a gel. The same 4,361 bp plasmid in three forms gives three apparent sizes
-
Two renderings of the same placement: Bands, one measurable rectangle per fragment, and Raster, the gel as a camera sees it — each band a Gaussian smear whose brightness follows its mass, summed into the lane, so similar sizes merge into one fat band exactly as on a photograph. Both overlays them, and all three read the same numbers
-
Your own ladders, typed as a name and a list of sizes, drawn in the reference lane's colour rather than a sample colour — because a ruler is not a result — and a ladder carrying measured Rf values can be the calibration curve itself
-
Which bands this gel cannot put a size on, and which of two reasons applies — because they are fixed by different actions, and because only one of them can apply to any one gel. Which one depends on what is positioning the bands. On a ladder-calibrated gel the ladder's own measured
(bp, Rf)curve places every band, so the failure is a band outside that ladder's range: there is no mark to interpolate against, the band has no position at all, and it is not drawn. Phage λ cut with HindIII puts a 23,130 bp fragment above a ladder that stops at 20,000, so that lane shows six bands for seven fragments — count the bands against the fragment table, and read that size from the table. Once you cast at a percentage, the concentration model places every band instead and the ladder curve is not in play at all — so the only failure left is a band outside the resolving window of the percentage you cast, placed by damped extrapolation, and casting a different percentage brings it back. Each band that falls outside is named by size, not merely counted -
When a setting you chose did not affect this run. Per-lane DNA form only moves a band under the concentration model; in ladder-calibrated mode every band is read off the ladder's own curve, so a lane left on supercoiled is reported as having had no effect rather than quietly ignored
-
Which curve actually positioned the gel, which is not always the ladder you picked. Two of the ten built-in ladders carry measured
(bp, Rf)points and can position a gel; the other eight carry marks only, and a gel showing one of those is calibrated on the default curve instead. The reading says so, with the ladder's span and its number of marks -
Which two bands the picture will merge, on the same criterion the Digest panel uses: two bands arrive as one when they land closer together than the gel draws a band, quoted as the separation against the band width
-
Which dye the gel was run with, and the colour that dye actually emits. Ethidium bromide, SYBR Safe, SYBR Gold and GelRed are offered by name with their published emission maximum and the transilluminator they are read on. The band colour is derived from that maximum through the CIE 1931 standard observer, so ethidium bromide comes out the orange every UV photograph shows and SYBR Safe comes out green because 530 nm is green — not because someone picked green. Changing the dye changes the hue and never the brightness: how strongly a band shows is the fragment's mass, which the dye does not alter
-
What the dye does NOT tell you. No stain is drawn brighter than another. Relative sensitivity depends on quantum yield and extinction coefficient, which the manufacturers do not publish in a form that could be compared here, so the picture does not imply that one dye detects less DNA than another
-
What band brightness is measured against — and the plate says which. An intensity is a quantity, and no picture can draw a quantity without dividing it by something. Whole plate divides every band by the brightest band anywhere on the gel, so this band is brighter than that one stays true across lanes — and a lightly loaded lane, a marker above all, can come out almost black beside a heavy digest. Per lane divides each lane by its own brightest band, so every lane is legible and no between-lane comparison survives. Neither is the "right" one and neither is applied silently: the line under the gel names the reference that drew it, because two gels of the same tubes under the two references are two different pictures
A saved gel keeps the ladders it was read against, since a gel calibrated off a photograph is not reproducible without them.
What it does not compute: how much DNA you loaded. Brightness follows fragment mass, drawn against whichever reference you chose, which is a rendering of the placement rather than a quantification of your sample. A fragment that falls outside what the calibrating curve can reach has no position on the gel and is not drawn at all — it is in the lane's table, and it is not part of what the brightness scale is stretched over.
Where it lives
Tools → Virtual Gel Bench, or the command palette. It reads the open molecule when you ask it to (one click loads it as a lane, with its topology already set from the record) and receives lanes pushed from the Digest, PCR and Ligation panels. Gels you build can be named, saved and reloaded.
A gel can also be run as a step rather than by hand, from a pipeline or by asking the assistant, and what comes back is the same reading described above — not just the band positions. That distinction matters here more than it does on most tools: a band's position is a number whether or not the gel could actually measure it, so a run that returns positions alone will hand you a size for a fragment that lay off the end of the ladder, with nothing to mark it as extrapolated. Run as a step, the off-scale bands, the ones outside the resolving window, the co-migrating pairs and the curve that actually positioned the gel all come back with it, at the same settings the panel opens on.
Inputs and outputs
In: the open record; a pasted or typed list of bp sizes, in any of the formats a list normally arrives in (commas, spaces or newlines); or lanes sent from another tool, which arrive carrying the right DNA form — a ligation that closed a circle arrives as relaxed, not supercoiled, because nothing in a ligation tube introduces negative supercoils.
Out: the gel as an image, and the saved gel itself, which persists between sessions.
What it refuses: a lane needs at least one positive integer size; non-numeric input is dropped rather than silently treated as zero. A lane name that already exists on the gel is numbered rather than duplicated, so every lane can be referred to.
Worked example
Open the Virtual gel bench sample project. Click Load open plasmid as a lane — SYNPBR322
arrives as a 4,361 bp circular lane, form supercoiled. In the second lane paste the λ/HindIII
marker sizes:
23130, 9416, 6557, 4361, 2322, 2027, 564, 125Set Agarose to 1 %. The bench reports "Resolves 500 bp – 10 kb", and you can read the consequence directly off the gel: the 23,130 bp band is jammed against the well, the 564 and 125 bp bands are crushed together at the dye front, and only the middle of the ladder is usefully spread out. That is the correct behaviour of a 1 % gel, and it is why nobody sizes a 125 bp product on one.
 The open plasmid as a supercoiled lane beside a λ/HindIII marker. Note the plasmid's single band
sits near 4.5 kb rather than at its true 4,361 bp — supercoiled DNA is compact and runs ahead of
linear DNA of the same length.
Controls
- Ladder — the MW reference, which both calibrates the migration curve and is drawn.
- Agarose % — Ladder-calibrated is the default: bands are placed by interpolation on the ladder's own measured curve, with no concentration term. Pick one of the ten casting percentages the concentration laws are defined at — each row tells you the window it resolves — and migration switches to that model. Custom percentage… takes any figure from 0.3 % to 5 %, for the gel you actually poured: under Rill/Van Winkle that is a genuinely different gel anywhere inside the 0.5–1.3 % it was measured over, and under Helling–Goodman–Boyer the panel tells you which of the ten anchors your figure was modelled at rather than pretending to a precision the law does not have. The same control appears on the Restriction Digest, PCR, Fusion and Multiplex gels.
- Model — Helling–Goodman–Boyer (the default) or Rill/Van Winkle. See Restriction Digest → Algorithms for what distinguishes them.
- Draw as: Bands · Raster · Both. Bands draws one measurable rectangle per fragment. Raster draws the gel the way a camera sees it: each band a Gaussian smear whose brightness follows its mass, summed into the lane, so fragments of similar size merge into one fat band exactly as they do on a photograph. Both overlays the rectangles on the smear. All three read the same placement.
- Per-lane DNA form — linear, supercoiled, nicked or relaxed, set independently for each lane, because one gel routinely carries more than one topology.
- Marker ladders you type in — a name and a list of sizes. These draw as their own lane, in the reference lane's colour rather than a sample colour, because a ruler is not a result.
- Calibrate — which
(bp, Rf)curve positions every lane: the built-in ladder, or a ladder of your own carrying measured Rf values. See below. - Lane name, order and removal, plus save / load / delete for whole gels — a saved gel keeps the ladders it was read against, since a gel calibrated off a photo is not reproducible without them.
Calibrating the gel from your own photo
Everything above places bands on a curve measured from a commercial ladder under someone else's run conditions. Your gel is not that gel: your buffer, your voltage, your run time and your rig all move where a given fragment ends up. If you want the model to agree with the photo on your bench, give it your photo's curve.
Measure the Rf of each marker band in your own image — the distance it travelled divided by the
distance from the well to the dye front, so a number between 0 and 1 — and enter the ladder as
bp:Rf pairs:
10000:0.10, 5000:0.35, 1000:0.80Pick that ladder under Calibrate and the entire gel is repositioned onto your curve: every lane, including the reference. The caption below the gel names whichever curve is driving, so you can never be looking at a calibrated gel without knowing it.
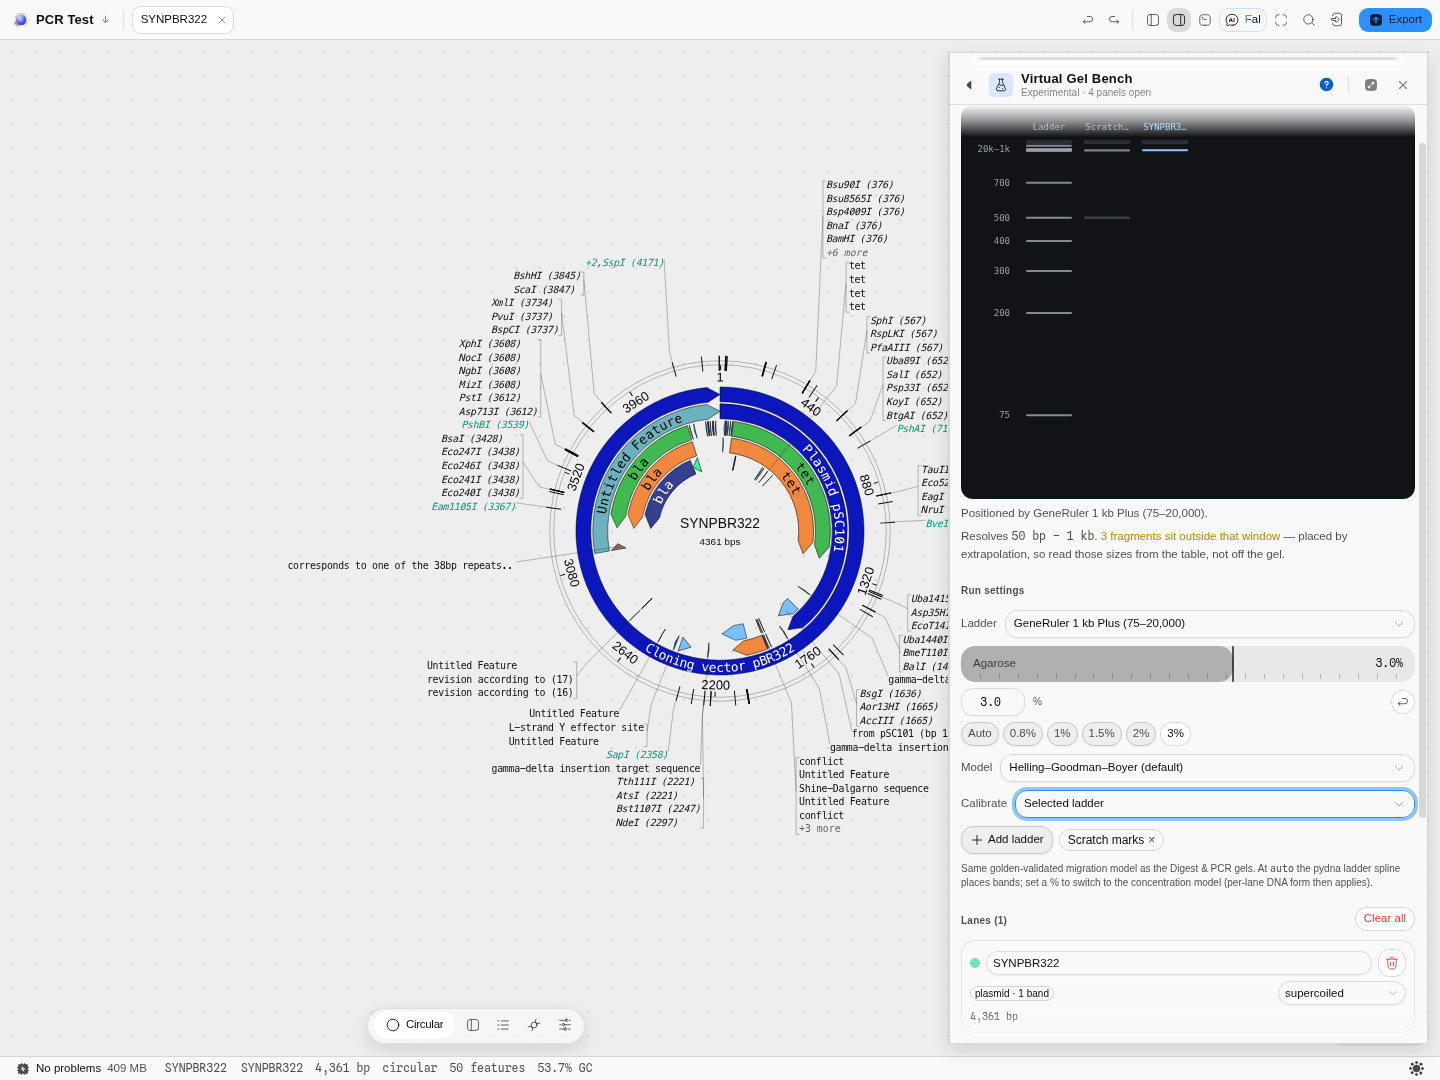 Three lanes on one curve at 3 %: the built-in reference, a marker ladder typed in by hand, and a
supercoiled plasmid. The marker lane is drawn in the reference lane's colour, not the next
sample colour — a ruler is not a result, and colouring it like one invites you to read it as a
sample. The note under the gel names the window this gel resolves and flags the three fragments
sitting outside it.
What it refuses, and why. Half a table is a typo, not a mode: a curve cannot be fitted through some of your marks, so a ladder where only some sizes carry an Rf is rejected with the count ("2 of 3 have one"). Rf must also fall as length rises — a longer fragment cannot travel further — and a table that violates it is refused naming the two offending marks rather than restating the rule. A ladder with sizes but no Rf values is still useful as a marker lane; it simply cannot calibrate, so under Calibrate it appears greyed-out reading "— no Rf values". It is listed rather than hidden on purpose: an option that silently is not there reads as a missing feature, and this way the fix is obvious — add the Rf values.
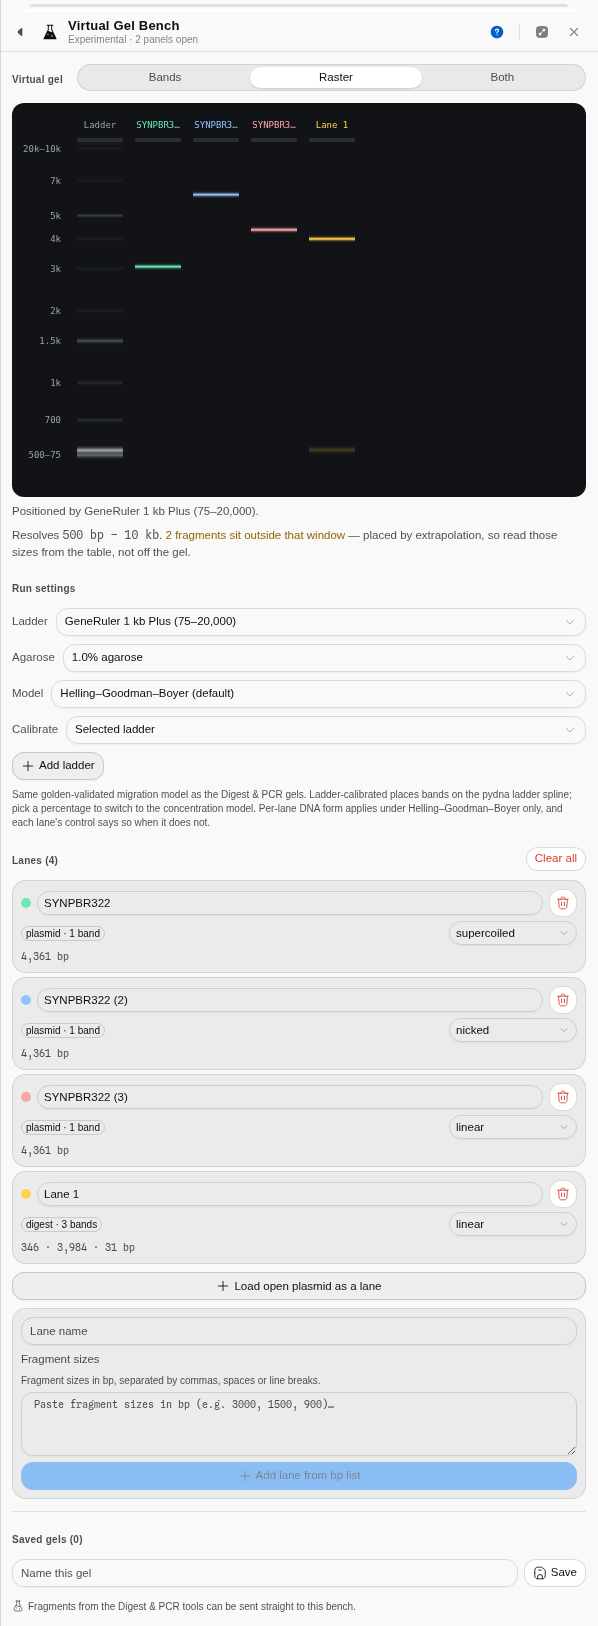 Both mode. The lane on the right carries 4,000 · 3,800 · 3,600 · 1,200 · 1,100 bp — five fragments
that appear as two bands, because that is what a gel does with sizes this close. Reading five
distinct bands off this lane would be a mistake, and the point of the raster is to show you that
before you run it.
The science
Bands are placed by the same migration model every other gel in the workbench uses, so a fragment of a given length lands in the same place here as it does on the digest's gel or the PCR gel. Each lane is computed against the same ladder calibration, which is what makes cross-lane comparison meaningful — if two lanes were scaled independently, lining bands up by eye would be an error.
The form factor is a multiplier on the effective size a molecule behaves as. Supercoiled DNA behaves as roughly 0.7× its length, because it is wound into a compact shape that threads the matrix easily; nicked and relaxed circles behave as roughly 1.4×, because an open circle is a floppy loop that snags. Linear DNA is the 1.0 reference. This is the standard explanation for the classic three-band appearance of a "pure" plasmid preparation on a gel.
Outside the window a gel resolves, the length–mobility relationship flattens at both ends: large fragments pile up near the well, small ones near the dye front. The bench shows that faithfully rather than spreading bands out artificially, which is why an over-concentrated or under-concentrated gel looks wrong here in the same way it does in reality.
Provenance of correctness. The migration model, each band's mass, intensity and Gaussian spread, and the rendered gel image are checked against pydna's implementation to nine decimal places; the agarose concentration laws are checked against their published forms and against a numerical reference.
Limitations
- The model knows lengths and topology, and nothing else. Buffer, voltage, run time, loading mass and stain are not modelled, so band brightness is a function of fragment mass only.
- The concentration model is defined at ten casting percentages. A value in between is modelled at the nearest one, and the bench tells you which rather than implying a precision it does not have.
- The Rill/Van Winkle model's separation strength is approximate; use it for shape comparison, not for absolute sizing.
- No smiling, no distortion, no lane bleed. This is a model of separation, not a simulation of a photograph of an imperfect gel.
Export
The gel as an image, and named saved gels that persist between sessions.
Related
Feeds it: Restriction Digest, PCR, Ligation, or the open record directly. Follows it: the real bench.
Enzyme Collections
The enzyme list, scoped to the sequence you have open: every enzyme carries how many times it cuts this construct, Type IIS enzymes are flagged as cutting outside their recognition site, and the collection you make here is the one the digest tool offers.
Phylogenetics
Turn an alignment into a tree, then judge how much of that tree the data actually supports.