
Dot Plot
Put two sequences on two axes and read their shared structure off the picture — repeats, inversions, duplications and indels, at a glance.
| Reached by | Tools → Dot Plot |
| Formats | Any sequence already open in the project (GenBank, FASTA, SnapGene, .melad …) A selection on the map, as either axis TSV out (the matches) |
| Sample project | Dot Plot |
What it does
An alignment gives you one answer: the best correspondence between two sequences, under whatever scoring you asked for. A dot plot gives you all of them at once, and lets your eye do the interpreting.
The idea is a century old and still the fastest way to see structure. Lay sequence X along the horizontal axis and sequence Y along the vertical. Wherever a stretch of X resembles a stretch of Y, mark it. Similar sequences produce a diagonal line; everything interesting is a departure from that line.
| What you see | What it means |
|---|---|
| An unbroken main diagonal | The two are the same sequence, or nearly |
| A ladder of parallel diagonals | A tandem repeat |
| A line on the anti-diagonal | An inverted repeat — a hairpin, a transposon's arms, a flipped segment |
| A diagonal parallel to the main one but offset | A duplication |
| A break in the diagonal | An insertion or a deletion |
| A block displaced sideways | A translocation or a rearrangement |
This is structural information an alignment score cannot express. Two sequences with the same percent identity can have completely different plots, and the plot is the one that tells you the region you care about was inverted rather than merely divergent.
On the sample project's cricket COI gene (Phaneroptera falcata, 601 bp), a self-comparison at 10 bp words draws the full 601 bp main diagonal and two short internal repeats — 3 matches, 100% of the sequence covered. On human haemoglobin alpha against myoglobin (142 and 154 residues), the scored engine finds 7 conserved runs, the longest 15 residues, covering 29.6% of one and 25.3% of the other: the globin fold, visible as broken diagonal segments between two proteins that share barely a quarter of their residues.
When you'd use this
Used in: Align a set of homologues and build a tree from it
Four situations, and the engine you want differs in each:
- "Is there a repeat in here?" You have one sequence and want to know whether it contains tandem repeats, inverted repeats or internal duplications. Compare it with itself — a self dot plot is the standard way to see them, because a repeat is a place where a sequence matches itself off the main diagonal.
- "Did my construct assemble the way I think?" Plot your assembled sequence against the reference. A clean diagonal says yes. A break says an indel; a jump says a rearrangement; a segment on the anti-diagonal says a fragment went in backwards.
- "How are these related?" You have a set of homologues and want to see, before committing to an alignment, which ones are similar and where. The all-against-all grid puts every pair in one picture.
- "These proteins are too diverged to align cleanly." Below roughly 30% identity, exact matching finds nothing at all and simple identity windows are barely better. This is what the scored engine exists for: it knows that lysine→arginine is a conservative substitution and lysine→proline is not.
Reach for something else when: you need coordinates rather than a picture — an actual alignment with gaps, positions and a score. Two sequences you want aligned go to EMBL-EBI Services (needle/water); several go to Multiple Sequence Alignment. The dot plot is the step before those: it tells you whether a global alignment is even the right question, which it is not if the two sequences differ by a large inversion.
What this computes
Every correspondence between two sequences at once, rather than the single best one an alignment returns — and the structure you read off the picture is the output: an unbroken main diagonal (the same sequence), a ladder of parallel diagonals (a tandem repeat), a line on the anti-diagonal (an inverted repeat), an offset diagonal (a duplication), a break (an indel), a displaced block (a rearrangement).
Three engines, three definitions of "similar" — and which one ran is stated with the result:
- Exact word (k) — every exact match of length k. The word size is suggested from the sequence lengths so chance matches stay under one, until you set it yourself
- Windowed — how many positions in a window must be identical, which is what lets a diverged repeat appear at all
- Scored — a windowed substitution score above a threshold, under EDNAFULL (nucleotide) or BLOSUM62 (protein) chosen by alphabet unless you pick one, or your own matrix pasted in standard format
Per run
- The match set: every match's position on both axes and its length, drawn as the plot and available as points
- Both strands when asked — the reverse-complement comparison is what puts an inverted repeat on the anti-diagonal, and it is nucleotide-only
- Best path only — a non-overlapping set of matches that could belong to one colinear alignment,
which is what makes a rearrangement legible inside a repetitive sequence. Longest match first; a
match that crosses one already kept is dropped, and one that runs into it is cut back to its
colinear part (kept only while it is still a full word long), as EMBOSS
dotpathdoes - The match count, made correct on a self comparison: a self plot reports the shared main diagonal twice, and merging duplicate runs fixes the count — left switchable because off reproduces the reference implementation's output exactly
- IUPAC ambiguity codes expanded or not, and how much of a word may be
N/Xbefore it is skipped - How much of the picture is chance, stated for whichever engine ran and never carried over between them. The exact-word and windowed engines get a closed form — the marks two unrelated sequences of these lengths and these compositions would have produced, counted over the comparisons the run really made, and reported beside the count under the uniform alphabet the word-size suggestion is calibrated on. The matrix-scored engine gets an experiment instead, because a score threshold has no combinatorial form to transfer: the same run is repeated against a shuffled copy of the second sequence, which keeps its composition and destroys its order, and the mean, standard deviation and 95th percentile over those replicates say what an unrelated pair would have drawn. It is seeded, so the figure reproduces
A grid runs the same comparison all-against-all: N sequences means N² plots, bounded by a sequence limit and a residue limit — the latter is what actually bounds the work, because many short records can be cheaper than a few long ones.
The comparison budget is a refusal, not a science limit. A quadratic comparison can take the session with it, so a run that would exceed the budget is refused with the number — raise it when you mean to wait.
Where it lives
Tools → Dot Plot opens it in the right rail. The command palette knows it as dotplot. The
plot and the all-against-all grid can each be detached to the canvas, where they get the whole stage
— worth doing for a grid, which is N² panels in one coordinate space and unreadable at rail width.
Context flows both ways. Each axis follows the sequence you have open, and follows it as you switch documents; a run you click in the plot selects those bases on the map, focusing that sequence's tab first if it is not the one in front of you — and opening it, if that record is not yet a document of its own. When the plot is taking the whole stage, it steps aside so the selection is visible on the sequence it was made on; the picture is one press away again, and the grid is unchanged.
Inputs and outputs
It accepts any sequence open in the project, a selection on the map, or a pasted sequence — as either axis, independently. Nucleotide and protein are both first-class, and the alphabet is read from the record rather than guessed: pick a protein and the residue count, the word size unit, the scoring matrix and the reverse-complement pass all follow it.
It produces the plot, a summary (longest match; matches drawn, forward always and reverse only where the reverse strand was examined, since only the exact-word engine has a reverse pass and only on a nucleotide pair with it switched on; and the fraction of each sequence covered), and the matches themselves as TSV.
What it refuses, and why:
- A protein against a nucleotide. The comparison is meaningless — residues against bases — so it is refused rather than plotted. Back-translate one or translate the other first.
- A set that mixes protein with nucleotide, in the grid. It names the offending records: "This set mixes protein with nucleotide, so the off-diagonal cells would compare residues with bases. Remove «HBA_HUMAN», «HBB_HUMAN», «MYG_HUMAN», or build a set of one kind."
- A comparison too large to compute. The windowed engine is quadratic, so the panel tells you what a run will cost before you press Plot — "this run is 1,597,696 window comparisons, 4% of the budget" — and turns the line red when it will be refused. Three remedies, and you pick: raise the step to coarsen the plot, compare shorter regions, or raise the budget and accept the wait.
- A set too large for the grid. Every pair means N² plots, so the grid states the cost the same way — sequences, residues, plots — and refuses past its two ceilings, naming which one stopped it. Both are yours to raise: the sample project's nineteen HIV-1 env genes are past the default sequence ceiling, and plot as a 729-panel grid once you lift it.
- A scoring matrix it cannot read. The reason appears under the box as you type, not after you press Plot.
Worked example
Human haemoglobin alpha against myoglobin — two globins whose relationship is invisible to exact matching and obvious to a scored comparison. Open the Dot Plot sample project and follow along; the numbers below are what you should see.
1. Open the starter and switch to One comparison. The project carries eight cricket COI genes, nineteen HIV-1 env genes and three human globins. The panel opens on the all-against-all grid; the first tab is the pairwise plot.
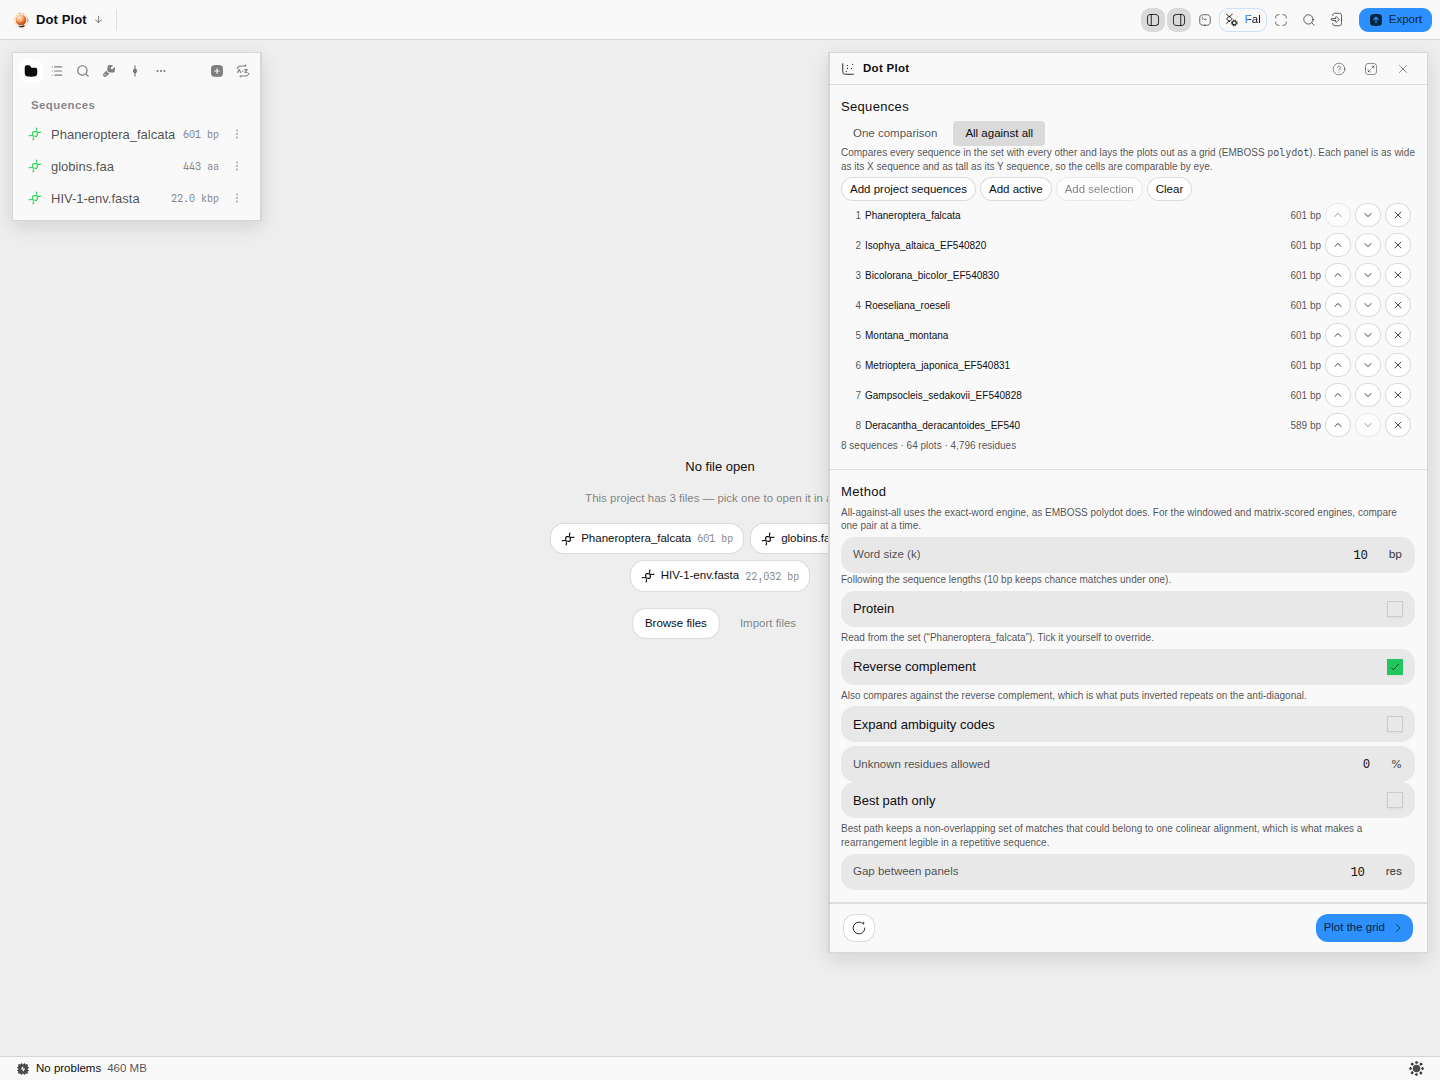 The panel as it opens — eight real COI records, 64 plots, 4,796 residues.
2. Set each axis to a project sequence. Turn off Compare with itself to reveal the second
axis, then set the first to sp|P69905|HBA_HUMAN · 142 aa and the second to
sp|P02144|MYG_HUMAN · 154 aa. Every record in the project is offered, each with its own length and
unit — aa for the globins, bp for the crickets.
3. Note what followed your choice. Protein is now ticked, and says where it got that from.
Reverse complement is off, because a protein has no reverse complement. The word-size unit reads
aa. None of this is a default you have to remember to change.
4. Choose the Scored engine. The window size becomes 10 and the matrix becomes BLOSUM62 — both following the alphabet, as the reference implementation does. The threshold is 23.
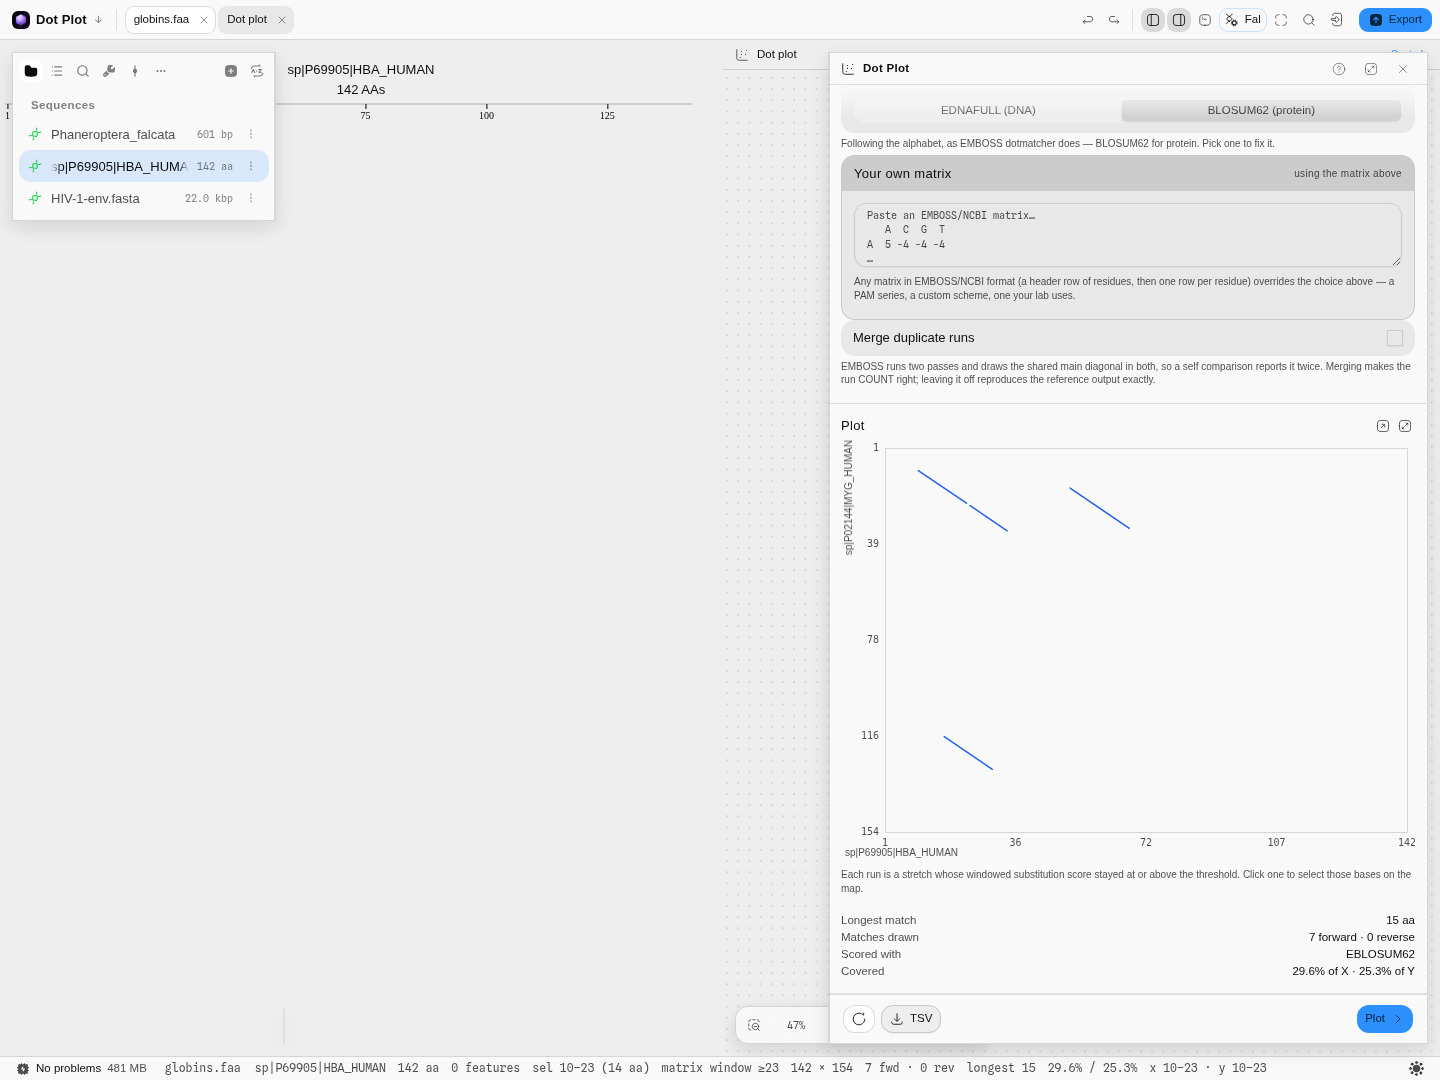 The scored engine, run on haemoglobin alpha against myoglobin: 7 matches, longest 15 aa, 29.6% of X and 25.3% of Y covered.
5. Press Plot. You get 7 forward matches, longest 15 aa, 29.6% of X and 25.3% of Y covered — broken diagonal segments tracking the conserved core of the globin fold.
6. Click one of the runs. Those residues are selected on the map. A run at 10..23 selects residues 10–23 of haemoglobin alpha, and the editor's readout says so in residues.
Now try it wrong, deliberately. Set the window size to 4 and plot again: 2 matches, 3.5% coverage. A shorter window with the same threshold demands that each residue score higher, and it empties a plot that was telling you something true. This is the single most common way to get a misleading dot plot, and it looks exactly like "these sequences are unrelated".
And the opposite failure, which is just as easy. Switch to the Windows engine on a cricket COI gene against itself and leave Matches required at 1. That marks a window whenever a single position agrees, which on a four-letter alphabet is nearly every window: 1,531,958 marks out of 1,597,696 comparisons — a solid grey square that has told you nothing. The panel warns you before the run; the useful setting is near the top of the range. At 9 of 10 the same comparison draws the 601 bp diagonal plus two real internal repeats, and covers 100% of the sequence.
Then the whole set at once
7. Switch to All against all, and add everything in the project. Thirty records — eight crickets, nineteen HIV-1 env genes and three globins. The panel refuses before plotting, twice over, and each refusal names what to do: the globins are protein among nucleotide, and thirty sequences is past the sequence ceiling.
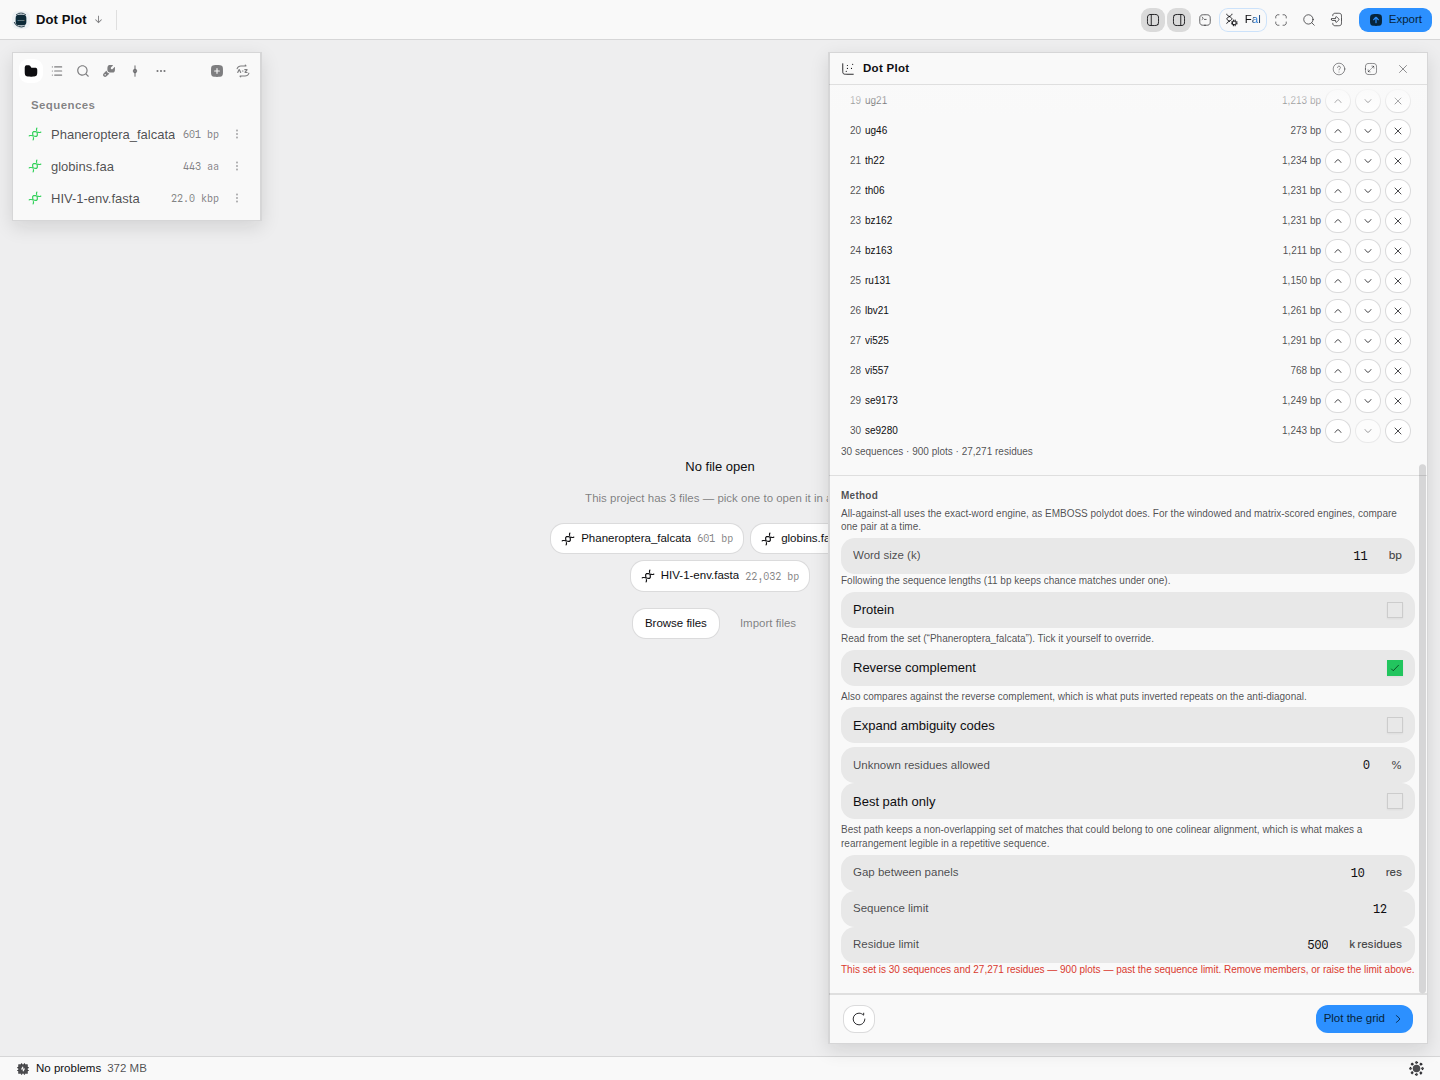 Thirty sequences and 27,271 residues — 900 plots — with the ceiling that stopped it named.
8. Remove the three globins, raise the sequence limit to 27, and plot. 729 panels. The eight crickets form a dense block of shared diagonals — the same gene across related species — while the same crickets against HIV-1 env are empty. An empty cell is a result: these genes have nothing in common at this word size, and the grid says so at a glance in a way twenty-seven pairwise runs would not.
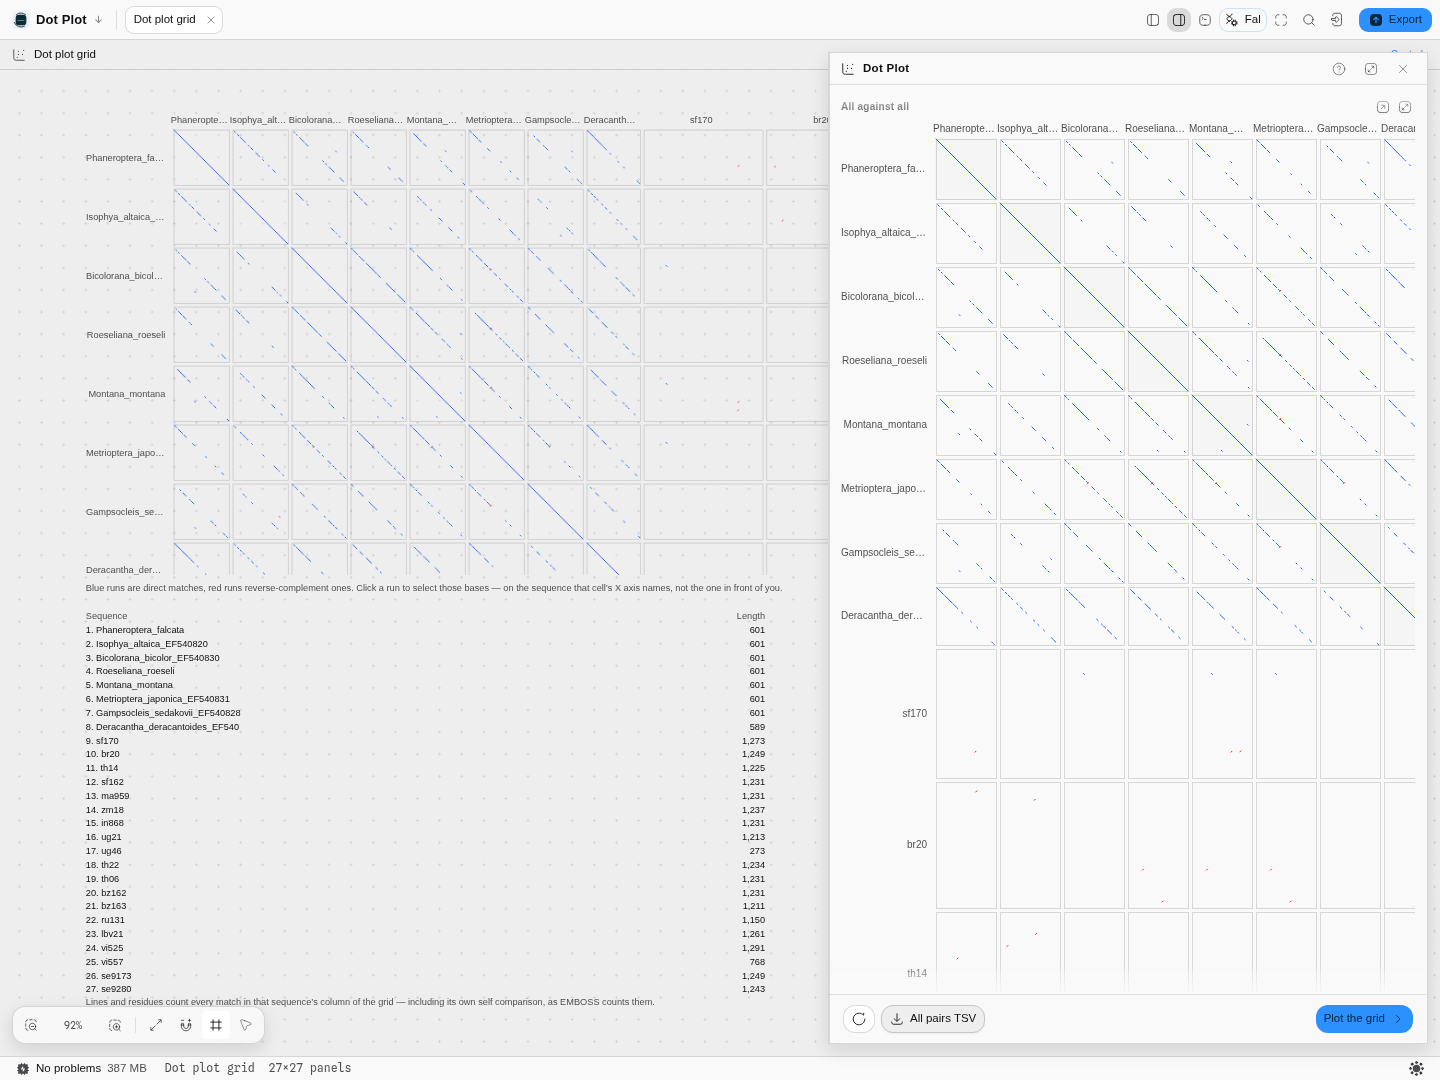 The grid reads at both sizes: full stage on the left, and in the rail on the right, where it scrolls rather than shrinking its panels past legibility.
Controls
| Control | What it changes |
|---|---|
| First axis (X) · Which sequence · Your own matrix | The X axis, the project sequence it reads, and a substitution matrix you paste in yourself. |
| First / second axis | Active document, a selection on the map, or any sequence in the project. Each axis independently. |
| Compare with itself | A self dot plot — how repeats, inversions and duplications inside one sequence show up. |
| Word size (k) | Exact-word engine: the length of the exact match required. Suggested from the sequence lengths so chance matches stay under one, until you set it yourself. |
| Window size | Windowed and scored engines: how many positions are judged together. |
| Matches required | Windowed engine: how many positions in the window must be identical. Setting it below the window size is what lets a diverged repeat appear at all. |
| Threshold | Scored engine: the windowed substitution score a stretch must reach. |
| Matrix | EDNAFULL for nucleotide, BLOSUM62 for protein — chosen by alphabet unless you pick one — or paste your own in standard format (a PAM series, a scheme your lab uses). |
| Protein | The alphabet. Read from the sequence you picked; tick it to override. |
| Reverse complement | Also compare against the reverse complement, which is what puts inverted repeats on the anti-diagonal. Nucleotide only. |
| Expand ambiguity codes | Treat IUPAC ambiguity codes as the bases they stand for, rather than as mismatches. |
| Unknown residues allowed | The share of a word that may be N or X before it is skipped. |
| Best path only | Keep a non-overlapping set of matches that could belong to one colinear alignment — what makes a rearrangement legible in a repetitive sequence. |
| Merge duplicate runs | A self comparison reports the shared main diagonal twice; merging makes the match count right. Leave it off to reproduce the reference output exactly. |
| Step | Windowed engine: coarsen the plot by sampling every nth position. The remedy for a comparison too large to compute. |
| Shift | Windowed engine: a phase offset applied to the second sequence's windows. |
| Shuffles | Scored engine: how many shuffled replicates the chance-mark estimate is built from. More replicates tighten it, and each one costs a whole plot. |
| Gap between panels | Grid only: the spacing between cells. |
| Comparison budget | Windowed engine: how many window comparisons a run may perform before it is refused. It exists to keep a quadratic comparison from taking the session with it, not to express a scientific limit — raise it when you mean to wait. |
| Sequence limit | Grid only: how many sequences the grid accepts. N sequences means N² plots. |
| Residue limit | Grid only: the set's total length. This is what actually bounds the work — many short records can be cheaper than a few long ones. |
Algorithms you can choose
Three engines, because the field has three, and none subsumes the others.
Exact words indexes exact k-mers, groups hits by diagonal and emits contiguous runs as line segments. It is near-linear, gives the cleanest lines, is ambiguity-aware and reports the longest common substring. It is blind to a repeat carrying a substitution every few bases: a word either matches perfectly or is invisible. Use it for nucleotide comparisons of related sequences, and for finding exact repeats. Method: Seibt, Schmidt & Heitkam, Bioinformatics 34(20)
.Windows slides a window over every position pair and marks it when at least n of the positions
agree, with an optional step and phase shift. It sees through mismatches — a diverged repeat still
shows — but every mismatch costs the same, so it cannot tell a conservative substitution from a
disruptive one. It is quadratic. Method: Charif & Lobry's dotPlot.
Scored scores each window with a substitution matrix and thresholds it. This is the only engine
that knows K→R is conservative and K→P is not, which is exactly what diverged protein needs; on
nucleotide it scores through IUPAC ambiguity instead of discarding it. It is blind only to
residues the matrix does not declare, and it says so rather than silently scoring them as zero.
Method: the EMBOSS dotmatcher algorithm.
All-against-all runs every pair in a set and lays the plots out as a grid, each cell as wide as its X sequence and as tall as its Y, so cells are comparable by eye. It uses the exact-word engine, as the reference implementation does; for the windowed and scored engines, compare one pair at a time.
Which to reach for: nucleotide and closely related → exact words. Nucleotide and diverged, or you suspect a repeat with substitutions → windows. Protein, or anything below about 30% identity → scored. When in doubt run two and compare; they answer different questions and disagreeing is informative.
The science
A dot plot's parameters are a signal-to-noise trade, and both directions fail visibly.
Too permissive — a short word, a low match requirement, a low threshold — and the plot fills with chance matches. Four bases have a 1-in-4 chance of agreeing at random, so in a 600 × 600 comparison a 4-mer is expected to hit thousands of times by luck alone. The main diagonal disappears into noise.
Too strict — a long word, a high threshold — and real similarity vanishes. This is the failure in the worked example above, and the dangerous one: an empty plot looks like a clean negative result rather than like a badly chosen parameter.
The default word size is derived from the two sequence lengths so that the expected number of chance matches stays below one, which is the principled place to start. The scored engine's defaults are the reference implementation's own: a window of 10 and a threshold of 23.
Two conventions worth knowing. A self comparison is symmetric, so every off-diagonal match is reported twice, once on each side of the main diagonal — the Merge duplicate runs switch decides whether you see the reference behaviour or the corrected count. And the anti-diagonal only means inversion if the reverse-complement pass ran; with it off, an inverted repeat simply is not there to see.
Correctness provenance. The three engines and the grid are each checked byte-for-byte against
the published reference implementations they are ports of — the exact-word engine against FlexiDot,
the windowed engine against seqinr's dotPlot, the scored engine against EMBOSS dotmatcher
compiled and run, best path against EMBOSS dotpath's reduction compiled and run over every pair
of the sample records, and the grid against FlexiDot's own all-against-all program. These checks
run on every change.
Shared with other tools: Alignment scoring compares how every tool that does this chooses its method.
Limitations
- The windowed engine is quadratic. A megabase against a megabase is not a dot plot you will wait for. The cost is stated before the run so this is a decision rather than a surprise; raise the step, compare regions, or raise the budget deliberately.
- The grid uses exact words only. A set of diverged proteins will show little in the grid even though the scored engine finds real structure pair by pair. Compare those pairwise.
- A plot is not an alignment. It shows you where similarity is, not what the correspondence is base by base. Take the answer to an aligner.
- The scored engine is blind to residues its matrix does not declare. They are reported, not silently dropped — but a matrix missing a residue you care about will not score it.
- A clicked run never lands on the wrong molecule. A multi-record file opens as one document per file, so a run on any later record of a multi-FASTA names a sequence that has no document yet; the pick opens that record as its own document and then selects on it. What it will not do is fall back to the file's first record — homologous records are often the same length, so that would pass a bounds check and draw a confident selection on the wrong sequence. If the record that opens is not the one the axis named, the pick refuses and says which one opened.
Export
TSV of the matches, named by the two axis sequences: start and end on each axis, length and
orientation for the exact-word and scored engines; window start, window size and match count for the
windowed one, which marks windows rather than runs. The grid exports the same table for every pair
in the set, including the halves the reference program's i < j filter drops — a self comparison's
own cell is there too. The plot itself can be detached to the canvas and exported with it.
The file is the plot: a 9-of-10 windowed self comparison of the sample project's cricket COI gene exports 640 rows against a status line reading 640 matches — 592 on the main diagonal and 48 off it, in symmetric pairs, which is what an internal repeat looks like in a table.
Screenshots
The panel as it opens — the all-against-all set, 64 plots over 4,796 residues.
The scored engine: haemoglobin alpha against myoglobin, BLOSUM62, 7 conserved runs.
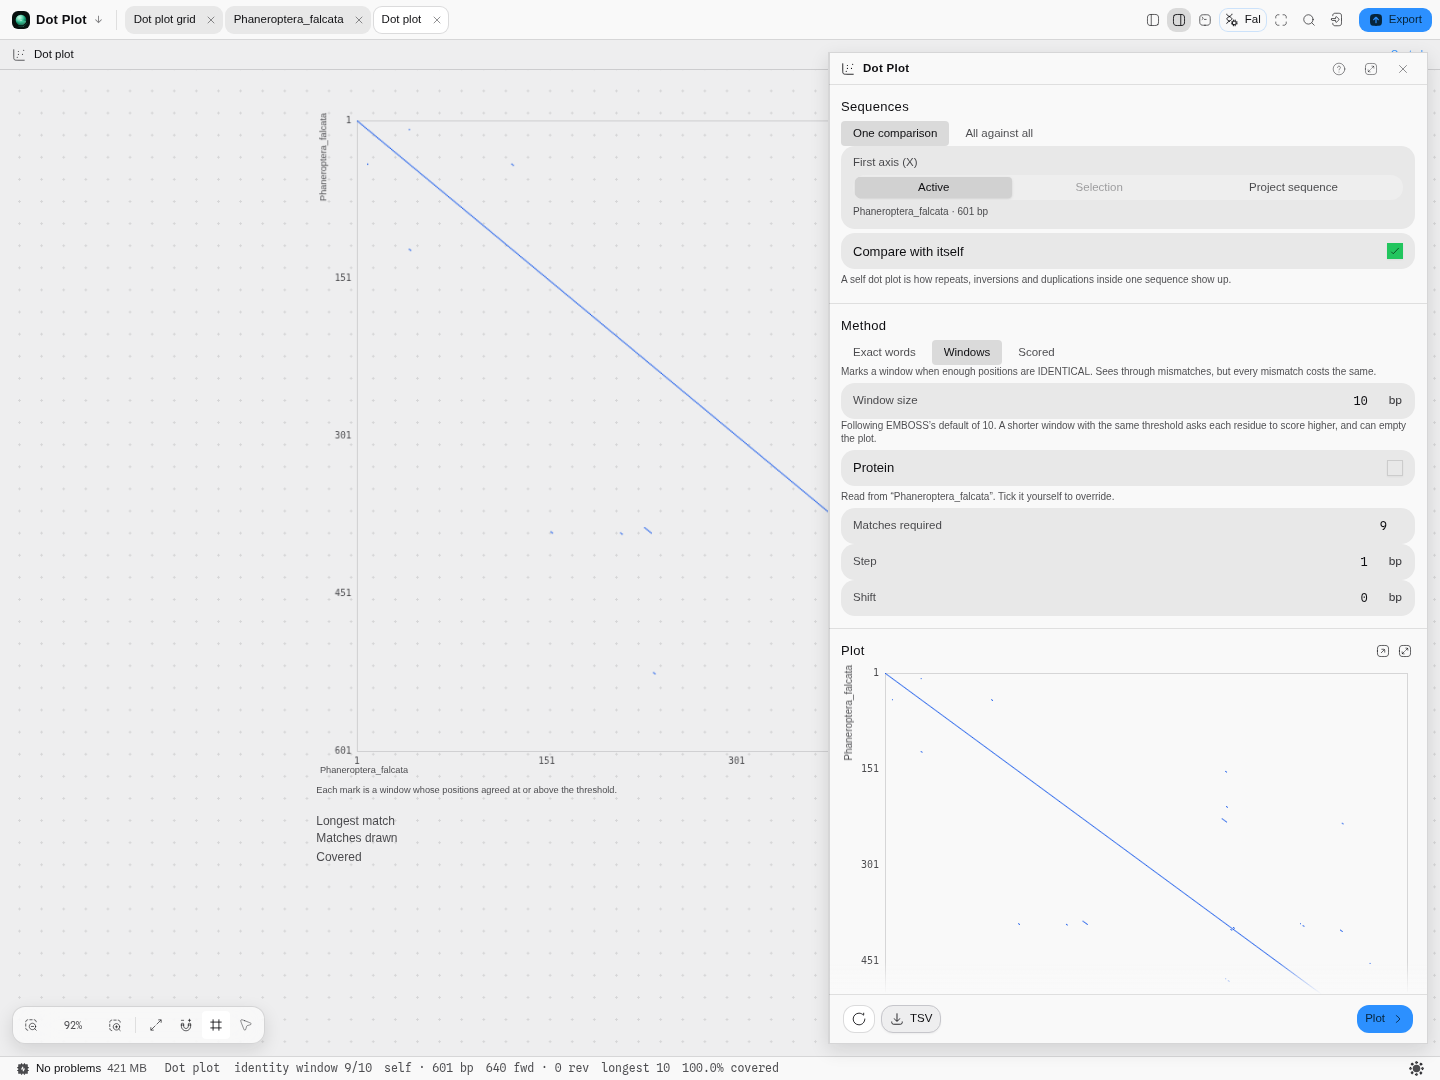 The windowed engine at 9 of 10 identical: the full main diagonal plus scattered internal repeats.
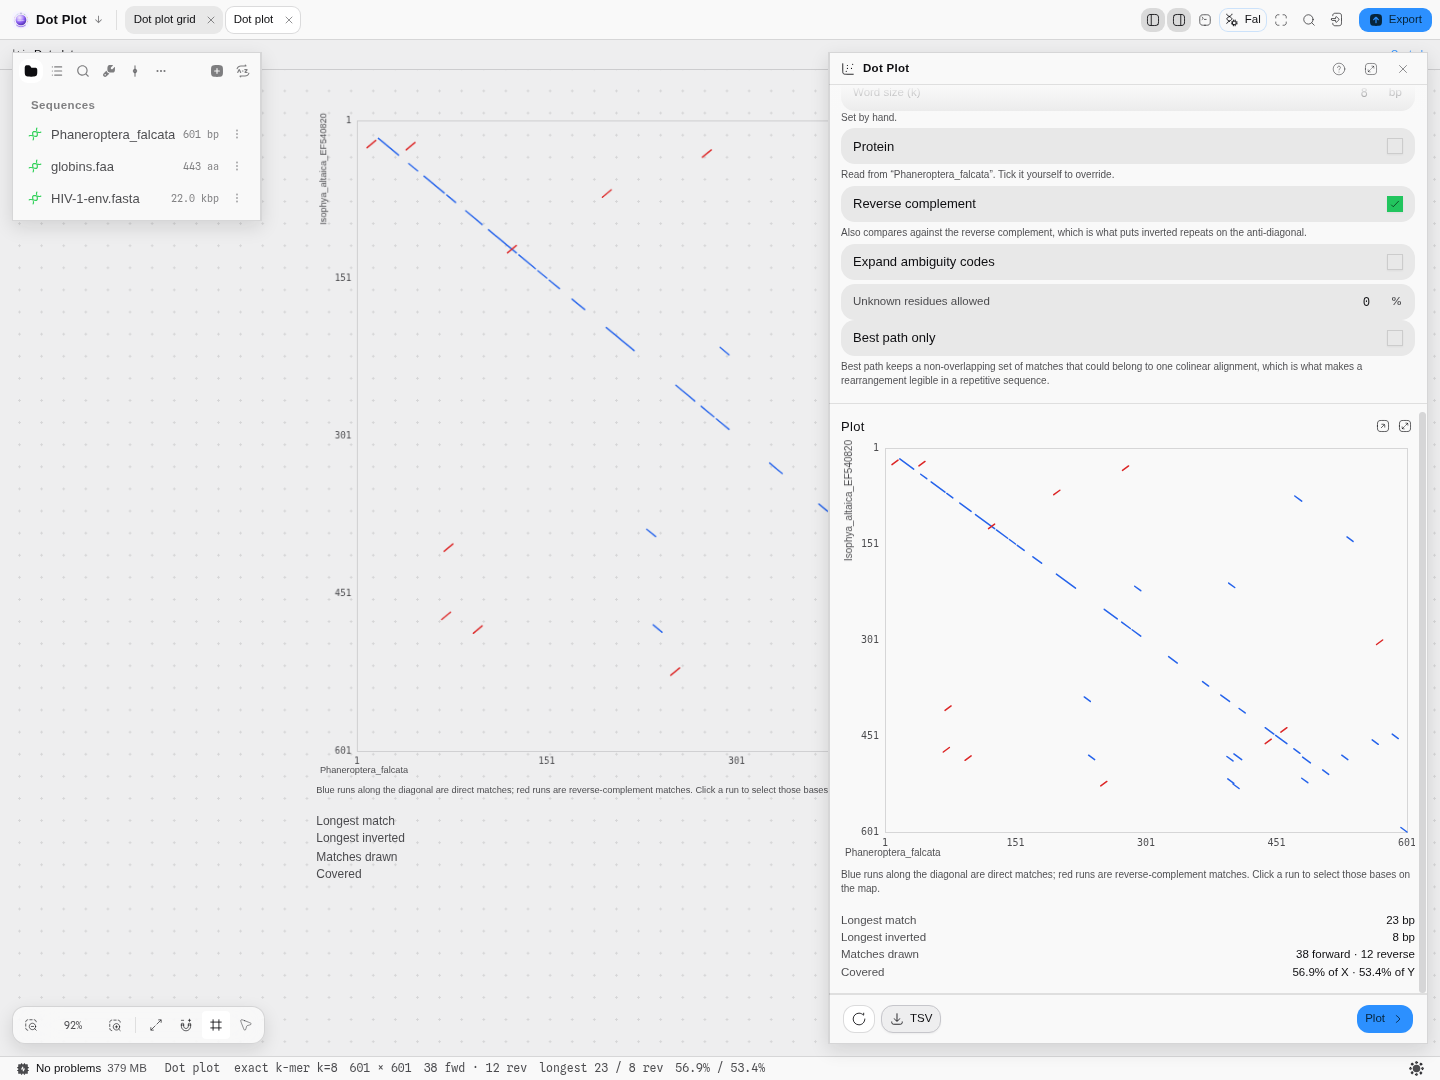 Two different cricket species' COI genes at 8 bp words: a broken main diagonal — real divergence between species — with 38 forward matches and 12 reverse ones in red. 56.9% of one covered, 53.4% of the other.
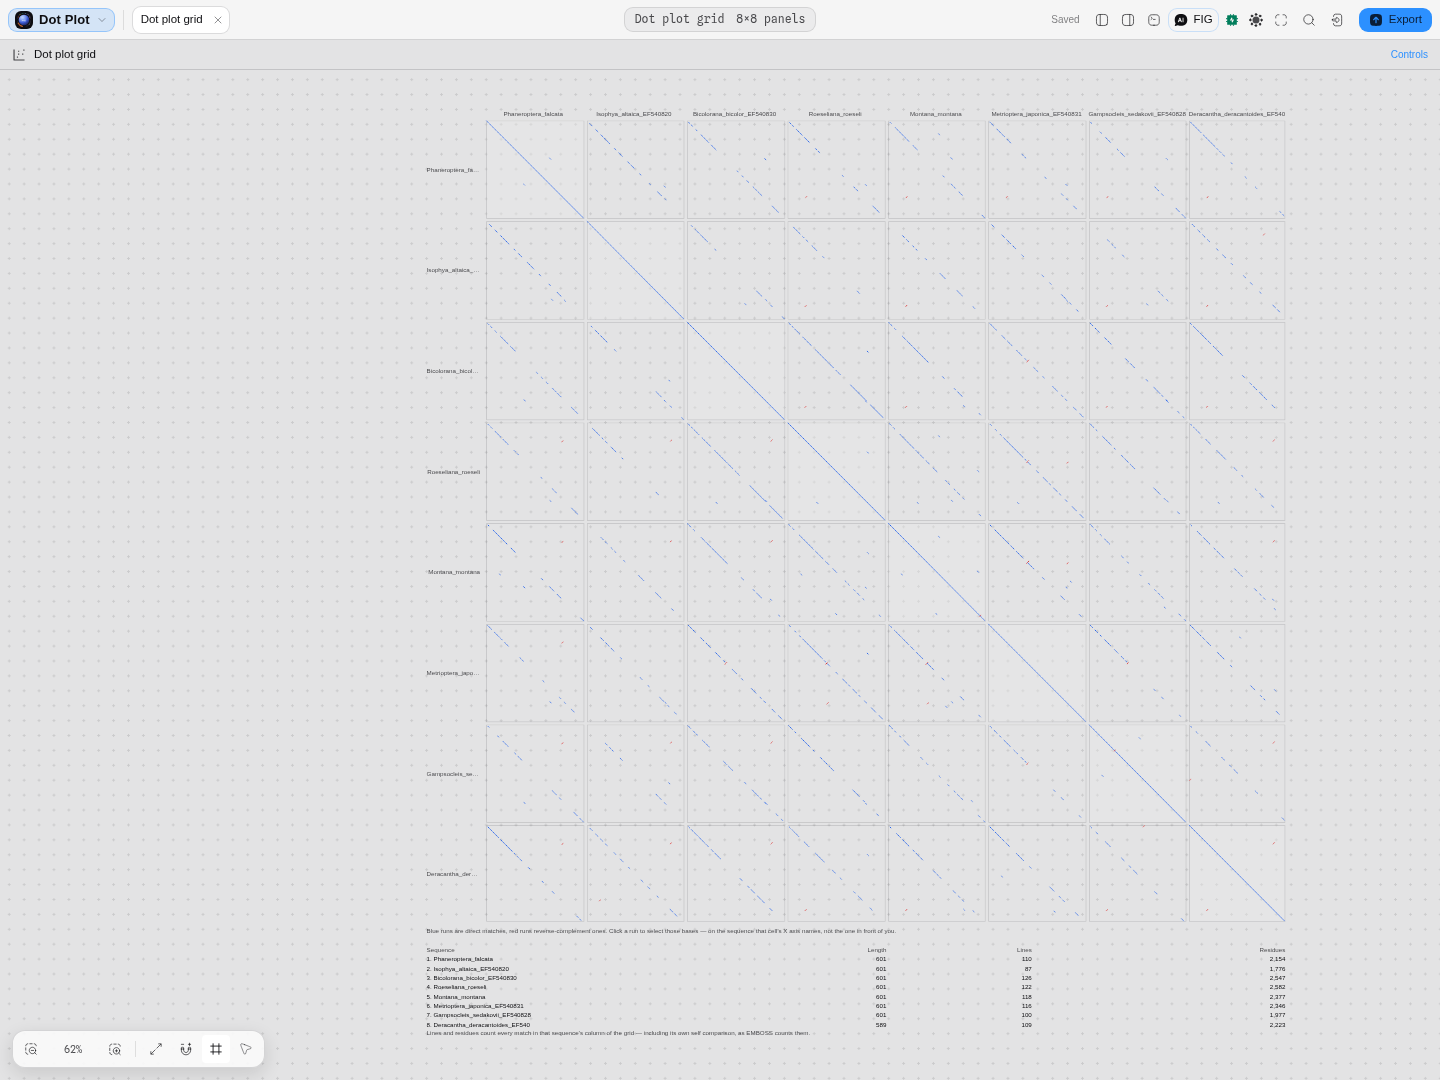 Eight cricket COI genes, every pair, with the per-sequence match table beneath.
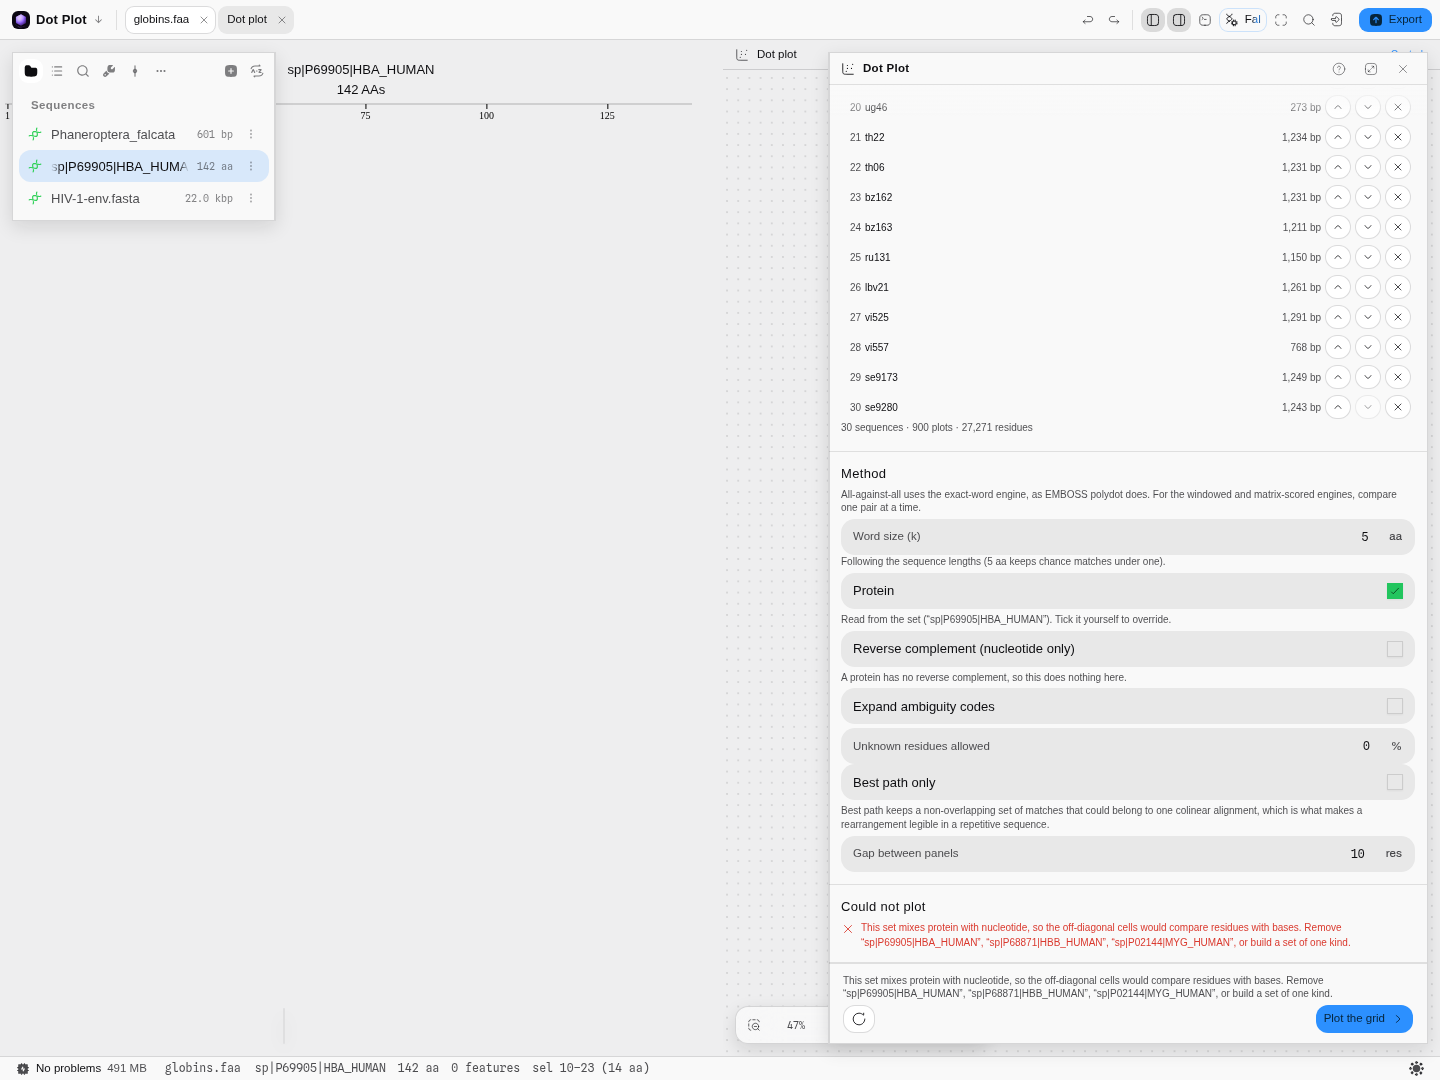 A set mixing protein with nucleotide is refused, naming the records to remove.
The sample project's crickets and HIV-1 env genes together — 729 panels. The cricket block is dense with shared diagonals; the same crickets against HIV are empty, which is the correct answer and the reason a grid is worth reading.
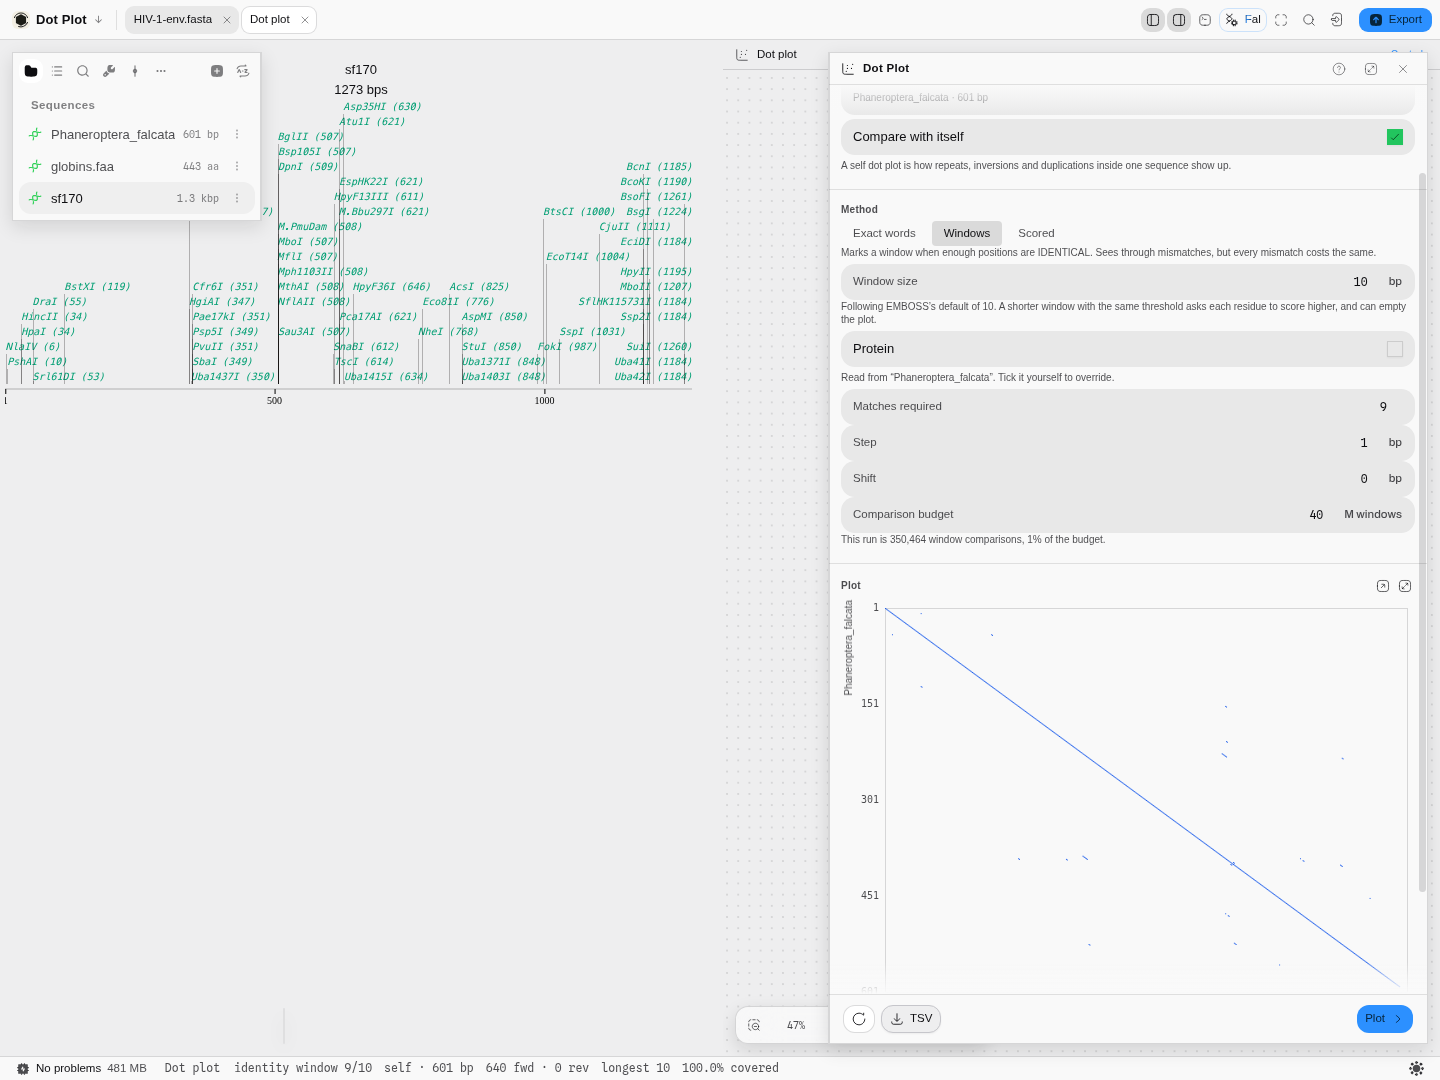 A cricket COI self comparison at 9-of-10 identity: 640 matches over the full sequence, with the run's cost given as a share of the budget.
Thirty sequences, 27,271 residues, 900 plots — refused before plotting, naming which ceiling stopped it and leaving both within reach.
Related
Feeds it: any open sequence, and any selection on the map. Follows it: Multiple Sequence Alignment and EMBL-EBI Services when you need coordinates rather than a picture; Phylogenetics when the question is how a set is related. An alternative to: a pairwise alignment, when what you want to know is structural — whether something is repeated, inverted or rearranged — rather than how well two sequences line up.
In this group: Properties · BLAST Search · Search Databases · EMBL-EBI Services · Protein Domains · Protein Analysis · Protease Digest · Antibody Numbering · Mass spectrometry: peptide masses, b ladders, isotopes, spectrum scoring, q-values, protein inference · Codon Usage Analysis · Site avoidance: restriction sites a genome avoids or favors · Codon outliers: genes whose codon usage departs from their own genome · Tree incongruence: genes whose own alignment rejects the species tree · Reference stability: reference genes against genes of their own abundance · Annotation contradictions: UniProt features a predictor scores unlike confirmed ones · Hypothesis ledger: pre-register a hypothesis, attach runs, decide with e-BH · Reagent audit: does each annotated CDS code for what the map says, and are its cryptic promoters, splice sites and repeats worse than chance · Assay decay: does a published assay still match current genomes, and is the mismatch at the 3′ end · Gene incongruence: which loci of a multi-locus alignment have a different history · Target validation: test "gene G drives phenotype P" against gene-level evidence tables · Codon Tables · Enzyme Collections · Virtual Gel Bench · Phylogenetics · Table · NumPy Array · Structure · PDF · Molecule · Image