
Bisulfite primer design
Marked experimental: the surface can change.
Find the CpG islands in an open sequence and design the primers that interrogate them after bisulfite treatment — either a BSP pair that amplifies both alleles for sequencing, or the two MSP pairs that make the band itself the result.
| Reached by | Tools → Primer Designer → Bisulfite · command palette → Bisulfite methylation primers · right-click a selection → Primers → Design a bisulfite assay in this selection |
| Sample project | Primer test — open EMX1_NC_000002.12, real human genomic DNA with six CpG islands |
What bisulfite conversion does, and why it needs its own primers
DNA methylation is a 5-methyl group on a cytosine, almost always a cytosine followed by a guanine — a CpG. It is chemically invisible to a polymerase: methylated and unmethylated DNA have the same sequence, so ordinary PCR cannot tell them apart, and sequencing reads the same C either way.
Sodium bisulfite changes that. It deaminates unmethylated cytosine to uracil, which reads as T after amplification, and leaves 5-methyl-C untouched. After treatment, methylation has become a sequence difference that any PCR can see.
The cost is that the sequence you designed against no longer exists. Nearly every C in the genome is unmethylated, so a treated template is dramatically T-rich, its two strands are no longer complementary to each other, and the primers you would order look nothing like the reference. That is why methylation assays need their own designer rather than a general primer tool: the design has to happen on the converted sequence, and which conversion depends on which allele you intend to catch.
Start where the methylation is: CpG islands
Most of the genome is CpG-poor, and an assay designed there reports on a handful of sites. Methylation that regulates transcription clusters in CpG islands — a few hundred to a few thousand bases with unusually high G+C and, more tellingly, far more CpG dinucleotides than that G+C content predicts.
Two published criteria sets are offered, and they are not one algorithm tuned two ways:
| Criteria | Window | Min length | Obs/Exp CpG | %C+%G | Use it when |
|---|---|---|---|---|---|
| Gardiner-Garden & Frommer (1987) | 100 bp | 200 bp | > 0.6 | > 50% | The classical definition, and the default. Sensitive. |
| Takai & Jones (2002) | 500 bp | 500 bp | > 0.65 | > 55% | You want promoter-associated islands only. |
The looser criteria also select Alu repeats, which are CpG-rich for reasons that have nothing to do with gene regulation — that is precisely why the stricter thresholds were published. If a scan returns many short islands in a mammalian genomic region, expect some of them to be repeats.
The observed/expected ratio is the number that matters. CpG is depleted across vertebrate genomes because methylated cytosine deaminates to thymine over evolutionary time, so a region that has kept its CpG sites is one that has not been methylated in the germ line. A ratio near 1.0 means the CpGs are all still there.
Island spans and statistics are checked against EMBOSS cpgplot, base for base, on every record of a
real test corpus.
What this computes
CpG islands — for each island: its span, its length, its CpG count, its G+C fraction and its
observed-over-expected CpG ratio, under whichever published criteria set you pick (Gardiner-Garden &
Frommer as EMBOSS cpgplot encodes it, or Takai & Jones 2002), with every threshold on the panel.
The conversion — all four sequences a bisulfite experiment can produce: the methylated and unmethylated alleles, each on the plus and the minus strand. Primers are designed against those, not against the original, which is why the oligos you are shown are the ones you would actually order.
Per primer — sequence, length, melting temperature, GC, the number of CpG sites it covers, and the number of non-CpG cytosines the original sequence carries under it. That last number is the one that makes a BSP primer bisulfite-specific: those cytosines only read as T if conversion worked, so a primer without enough of them anneals to untreated DNA just as well.
Per pair — the product span and the number of CpG sites inside it, which is what a sequencing read actually interrogates; and, for MSP, which allele the pair detects.
Per pair, as a report — each rule of the method checked against this pair's own numbers, in the words of the rule: no CpG under either primer for BSP, at least the required non-CpG cytosines, enough discriminating CpG for MSP, and a CpG count inside the product. A rule the pair misses is flagged rather than hidden, so a pair can be read as usable or usable except for this.
What is not computed — the methylation state itself. A design says where to look; the trace or the band is the answer.
BSP or MSP: two different questions
BSP — bisulfite sequencing PCR. One primer pair that amplifies the region regardless of its methylation, which you then sequence. Every CpG inside the product is read individually, so you learn the methylation pattern and the proportion of molecules methylated at each site. This is the quantitative answer, and it is the one to choose when you do not already know what you are looking for.
For the pair to be unbiased, its primers must cover no CpG at all — a primer sitting on a CpG would anneal better to whichever allele it was designed for and quietly skew every number downstream.
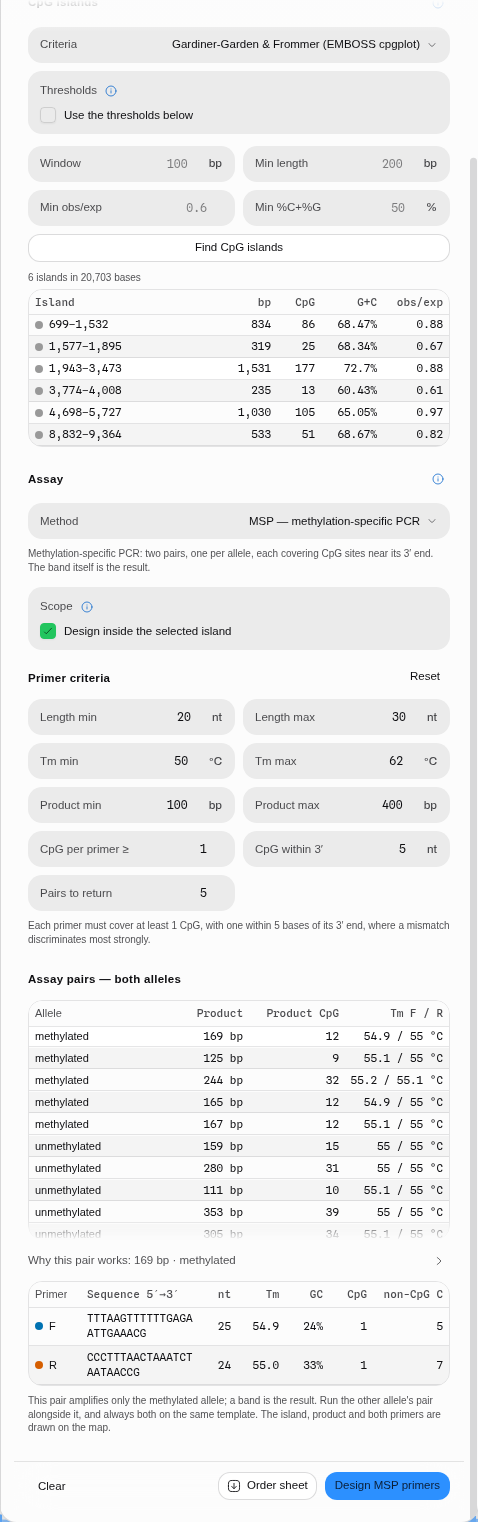
MSP — methylation-specific PCR. Two primer pairs, one per allele, each covering CpG sites so that it only anneals to the allele it was designed for. A band means that allele is present. This is faster, far more sensitive, and gives a yes/no rather than a proportion.
For an MSP primer to discriminate, its CpG sites must sit near the 3′ end, because that is where the polymerase extends and where a mismatch actually stops it. A CpG at the 5′ end changes almost nothing.
Both assays share one non-negotiable rule, and it is the one people most often get wrong: the primer must contain several non-CpG cytosines in the original sequence. Those are the positions conversion turns into T. A primer without them anneals to untreated DNA exactly as well as to treated DNA, so a failed conversion produces a beautiful band that means nothing. The designer enforces a minimum, and the count is shown per primer.
Designing an assay, step by step
- Open a sequence with real CpG density. In the sample project, open
EMX1_NC_000002.12— human genomic DNA around the EMX1 promoter. The target line reads20,703 bases · 739 CpG sites. - Choose the target. Editor selection to work in a region you have selected on the map, or Whole sequence. A selection is the normal choice once you know which promoter you care about.
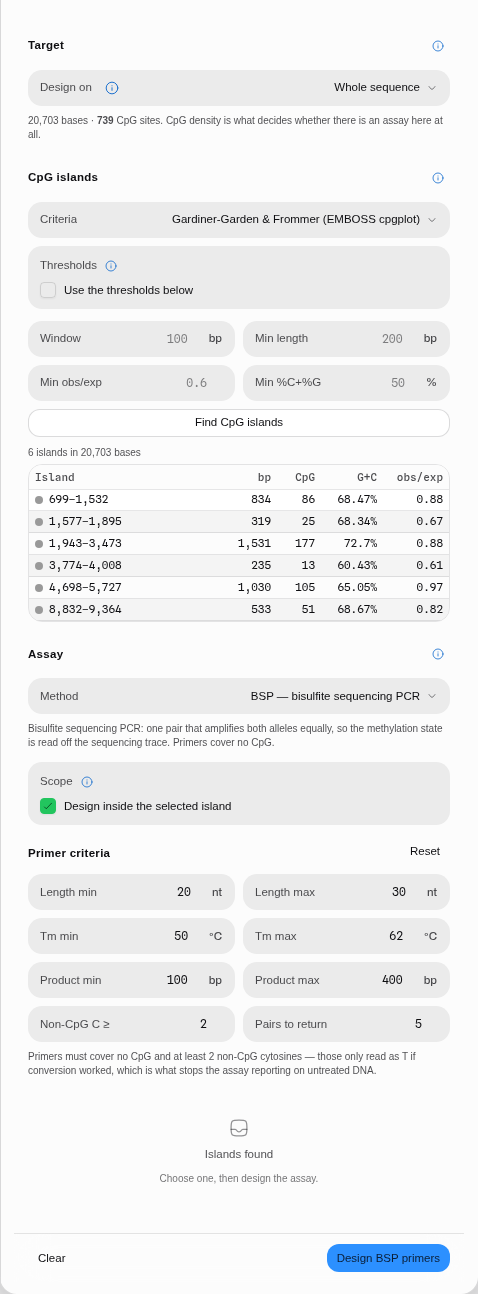
- Press Find CpG islands. On EMX1 with the default criteria, six islands are returned. The largest runs 699–1532, 834 bp, with 86 CpG sites, 68.47% G+C and an observed/expected ratio of 0.88 — an island that has kept nearly all the CpGs its composition predicts.
- Pick the island you want the assay in. It highlights on the map, so you can see it against the gene's own annotations. Assays are designed inside the selected island by default; turn Design inside the selected island off to search the whole target instead.
- Choose the assay. BSP if you intend to sequence the product, MSP if you want a band per allele. The criteria below change with the choice, because the two assays have genuinely different rules.
- Press Design. For BSP on that island the best pair spans 310 bp and covers 29 CpG sites — those 29 are what the sequencing trace will report on — with primers covering none, and 10 and 6 non-CpG cytosines respectively.
- Read the primers as converted oligos. They are T-rich and look nothing like the reference,
which is correct:
GGTAAGGTTTAGGTTTTAGTTTTTis what you order. For MSP, compare the two alleles' primers at the same site — the unmethylated one reads TG where the methylated one keeps CG. - Export the order sheet for the pair you chose, with length, Tm, GC, CpG covered and non-CpG C per oligo.
Pro tips and pitfalls
- A "no island" result is a real answer, not a failure. Most of any genome has no island. If a region you care about has none, either the methylation there is not island-associated or you have the wrong region — do not loosen the thresholds until something appears.
- Run both MSP pairs on the same template, always. A methylated band alone tells you nothing about whether the unmethylated pair would also have fired. The pairs are two halves of one experiment.
- MSP is a yes/no, not a measurement. Its sensitivity is its danger: it will detect a methylated molecule among many unmethylated ones, which is excellent for detection and misleading if you read the band as "this locus is methylated".
- Conversion is assumed complete here. Real bisulfite conversion is 95–99.9% efficient, and incomplete conversion is the single commonest cause of a false "methylated" call. No conversion efficiency is modelled, because that would mean inventing a rate; the non-CpG cytosine rule is what protects you instead, and it only works if you keep it.
- Bisulfite fragments DNA. Keep products short — the default 100–400 bp window is deliberate. Amplifying 800 bp of treated DNA frequently fails for reasons no primer can fix.
- Both strands are separate assays. After conversion the two strands are no longer complementary, so a primer pair works on one of them. Designing a second assay on the other strand is a real option, not a redundancy.
What it hands to, and takes from, the rest of the workbench
The island, the product and both primers are drawn on the shared amplicon track, so they appear on the circular, linear and sequence views alongside features, cut sites and anything another tool has drawn. Selecting a region on the map seeds the target, and the order sheet is the same CSV shape the other primer tools export.
What we offer that the incumbents do not
- The island scan and the primer design are one tool. Most workflows use a web form for islands and a different one for primers, with copy-paste and coordinate arithmetic in between.
- Two island criteria sets, both published, both selectable — and every threshold is on the panel rather than buried behind a "default parameters" link.
- The rules are visible and adjustable. Minimum non-CpG cytosines, minimum CpG per primer, how close to the 3′ end the discriminating CpG must sit: these are the decisions that make a methylation assay work, and they are controls here rather than hidden constants.
- MSP returns both alleles at once, not the methylated pair with the unmethylated one as a second run.
- The result is on the map, not just in a table — the primers are drawn against the CpG sites they do or do not cover, which is the one thing you actually want to look at before ordering.
LAMP primer design
Design a complete loop-mediated isothermal amplification set — F3, FIP, BIP, B3 and the two loop primers — against a region of an open sequence, under the criteria published by the people who invented the method.
Degenerate primers from an alignment
Design one primer that amplifies a whole family: the maximum-coverage degenerate oligo at every column of an alignment, under a degeneracy ceiling you set.