
PCR Simulation
Marked experimental: the surface can change.
Check a primer pair against a template and get the product it would actually produce, or find that it produces none.
| Reached by | Tools → PCR Simulation |
| Sample project | PCR, multiplex & fusion |
What it does
It runs the reaction on paper. Give it a template and two primers and it finds every place each primer anneals, on both strands, works out which of those sites pair into an amplifiable product, and returns the product's exact sequence — not its length, the bases — along with where on the template it came from.
The distinction that matters is between a product and the product. A primer pair that a spreadsheet says is fine will often anneal in three places, and two of those can face each other. So the panel does not report success; it reports a count, and says which of three situations you are in:
- one product — specific, one clean band;
- several — non-specific, and each one is listed with its own size and coordinates;
- none — and then it tells you why, per primer, rather than showing you an empty table.
On a circular template it wraps. An inverse-PCR pair pointing away from each other across the origin produces the product that runs the long way round through base 1, not its complement — which is the case that quietly breaks tools that treat a plasmid as a string.
When you'd use this
Used in: Design a CRISPR guide, check where else it binds, and measure the edit you got · Design primers, simulate the PCR, and predict the band
- Before you order oligos. The cheapest failed PCR is the one you find on screen. Check that the pair makes one product, at the size you expect, in the place you expect.
- Diagnosing a reaction that did not work. Load the template, paste the primers you actually used, and look at the binding sites. A primer with four sites, or a pair whose annealing temperatures are 8 °C apart, explains a smear better than any protocol tweak.
- Working out the programme. The panel derives the annealing temperature and the extension time from the product it just made, so the thermocycler programme is a consequence of the reaction rather than a guess carried over from the last one.
- Colony screening and genotyping. Confirm that a pair spanning an insertion gives two clearly different sizes in the two genotypes before you run a plate of them.
What this computes
The reaction, not a size estimate. Every place each primer anneals on both strands, which of those sites pair into an amplifiable product, and each product's exact bases.
Per product
- The product sequence, its length in bp, and where on the template it came from — with origin-spanning handled as a real case: an inverse-PCR pair pointing away from each other across the origin gives the product that runs the long way round through base 1, not its complement
- The count, as the answer: one product (specific), several (non-specific, each listed with its own size and coordinates), or none — and none comes with the reason per primer rather than an empty table
- GC% and the product's own melting temperature
Per binding site
- Position and strand, the footprint, and how many bases mismatched there — so you can see which sites a mismatch allowance bought, not merely that it bought some
- The footprint's Tm, computed for the mismatched duplex rather than the number it would have had if it matched. One internal substitution takes a typical 20-mer from about 58 °C to about 53 °C, which is often the difference between a pair that works at your annealing temperature and one that does not
- ΔG, ΔH and ΔS from the same nearest-neighbour table as the Tm, so a row never mixes two models
Per pair
-
The two footprint Tms and the gap between them, read against primer3's own limit for a pair — the value primer3web ships, 5 °C. One annealing temperature has to serve both primers, so the weaker one sets it: at its optimum the stronger primer is above its own, and that is where non-specific product comes from. Below the limit the spread is reported as a fact; past it, the reading says so and names both temperatures. The threshold is primer3's, checked against the settings files primer3 distributes, and the reading never invents one of its own
-
The dimer the two primers form with EACH OTHER, reported separately from either primer's dimer with itself. This is the distinction that matters at the bench: two primers can each be perfectly well behaved alone and still have complementary 3′ ends, and that pair is the classic primer-dimer band. Both configurations are given — the dimer anywhere along the two oligos, and the one with a 3′ end paired — and the reading names which primer's 3′ end is the anchored one, because that is the end a polymerase extends into a product. Measured on the same thermodynamic engine as the hairpin and self-dimer numbers, against primer3's own published limits, and under the buffer you set rather than a default one
-
Which buffer a quoted temperature belongs to. Every Tm and every annealing temperature here is a function of the salt, magnesium, dNTPs, oligo concentration and melting model you set: the same primer pair on the same template anneals at 60.5 °C in 40 mM Na+ and 61.9 °C in 200 mM. A result therefore belongs to the buffer it was computed in, and if you change the buffer afterwards the panel says so rather than letting the old numbers stand under the new conditions. Re-run to bring them forward
-
What a clean cross-dimer reading does and does not tell you. Those published limits are a design filter: they answer would this pair be rejected when primers are being picked?, which is a stricter question than will a dimer band appear on my gel? They are set at 35 °C for a 3′-paired dimer and 45 °C for one anywhere, and real primer-dimer artefacts routinely form from structures that melt far below either. Measured against a published set of 48 primer pairs that were run out on a gel (Johnston et al., Scientific Reports 9
, 2019), 23 produced a visible primer-primer band and none of them passed either limit — the most stable dimer in that whole set reached 24.5 °C at a 3′ end. So a reading of none means no dimer above the design limits, and it is not a prediction that the reaction will be free of them. The panel says so where the number is shown. Weak dimers are still worth designing away from: check the reported temperatures and the free energies beside them rather than reading only the flag -
A second dimer verdict: the PrimerDimer score. Beside those limits the panel reports the score of the PrimerDimer model (Johnston et al., Scientific Reports 9
, 2019), computed for the heterodimer and for each primer's homodimer, the most negative kept. It sums nearest-neighbour free energies over the 3′ end of every partial alignment, with the model's fitted penalties for unpaired terminal bases, then rescales by combined length and GC. Lower is more dimer-prone. The paper's dimer-free cut-off is −4.43 on this adjusted score, the threshold below which the first gel-confirmed dimer formed under the authors' own PCR conditions (a GoTaq mastermix with 4.5 mM MgCl₂ and 0.25 µM of each primer). The panel reads the pair against it in a PrimerROC verdict row that names the cut-off it used and the margin, and the Dimer-free cut-off control replaces it with one fitted to your own gels. On the same 48 gel-tested pairs it separates the dimer-forming ones better than the 3′ melting temperature (area under the ROC curve 0.84 against 0.73). Checked against the model authors' own implementation on every pair of their published fusion-primer sets -
DMSO and formamide reach these temperatures too. Adding DMSO lowers every primer Tm and therefore the annealing temperature the programme suggests; the depression is applied under whichever of the four published models you choose. See the melting-temperature page for the four coefficients and how far they disagree
The thermocycler programme, derived from the product it just made
- Annealing temperature under both conventions — Taq (SantaLucia) and Phusion/Q5 (DBD) — shown side by side, because the choice changes the number and the difference should be visible rather than hidden behind the setting
- Extension time from the product length, and the Tm of each primer in the salt conditions you set (Na⁺, Mg²⁺, dNTPs, primer concentration), with Mg²⁺ corrected for dNTP chelation
Two rules that are biology, not settings. The 3′ end must pair exactly however large the mismatch budget — so raising the budget never rescues a primer whose problem is at its 3′ end, and that is the correct answer rather than a limitation. And a mismatch is a substitution, never an insertion or a deletion. A degenerate primer (N, R, Y…) is refused while the budget is above zero rather than matched as literal letters.
The run's own reading, generated from the result. Above the table the panel says which of the three situations you are in, in a sentence built from this run — and no product is four answers, not one: neither primer anneals · the forward does not · the reverse does not · both do but no pair of sites faces inward. Which one you are in is what tells you what to change. One product states its size, its share of the template and the annealing temperature under the polymerase convention in force; several state the gap between the closest two, which is what decides whether a gel can tell them apart.
Under it, only the cautions this run earned — a hairpin or dimer past primer3's own published limit, quoted with both numbers; two primers that melt too far apart to share one annealing temperature, measured against the same source (primer3 treats more than 5 °C between a pair as a failure, and the caution says which way the compromise hurts: set the temperature for the higher primer and the lower one binds poorly, set it for the lower and the higher one binds unspecifically); the sites a mismatch budget bought and what their Tm therefore means; a 5′ tail that makes the amplicon longer than the span it came from. A clean run says nothing. Then the chain, folded: what was searched, the annealing rule, the sites found, both footprint Tms and how far apart they are against that same limit, the model and buffer, and the specificity.
Nested PCR computes the second round against the first round's product, not against the template, because a nested design is only as specific as its second round.
Where it lives
Tools → PCR Simulation, in the right-hand rail; also on the editor's context menu and in the command palette. It reads the open molecule as its template, and a selection on the canvas becomes a primer in one click — Use selection for the forward, or Use selection, reverse-complemented for the reverse, so a primer read off the map is never hand-transcribed.
Everything it computes that names a position is drawn on the canvas: the product as a span on its own amplicon track — a ring on the circular map, a labelled lane in the linear and sequence views — plus each primer's footprint and, separately, every site that annealed and made nothing. Those unproductive sites are the ones worth looking at, because they are where a second band comes from. Clicking a binding site in the panel moves the canvas selection to it.
Inputs and outputs
In: the open sequence as template, linear or circular, whole or the current selection. Two primers, entered as bases or picked from the project's primer library; a 5′ tail that does not match the template is fine and is handled as a tail. Optionally a second, inner pair for nested PCR.
Out: the product sequence with its length, GC and melting temperature; the template coordinates it came from; every binding site for both primers on both strands; a per-primer quality table; a suggested thermocycler programme; a virtual gel; a high-resolution melt curve; and the features of the template that fall inside the product, carried onto it.
What it refuses, and says so. No product is a result, not a blank screen: the panel says
No amplification. Forward anneals 0×, reverse 1×. — the count per primer, so you know which one
failed and whether it failed by not binding at all or by binding somewhere useless. The primer
quality table stays on screen in that state, because when nothing amplifies the primers are exactly
what you need to look at. A primer shorter than the 3′-match setting is named as unable to anneal
rather than silently ignored.
Demo
Silent, 17 seconds, recorded on the PCR, multiplex & fusion sample project. The primer pair the starter designed against pBR322's own tet gene amplifies one product of 1,191 bp at 61.5% GC, drawn as an arc on the map. Send to Gel Bench loads it into a lane beside GeneRuler 1 kb Plus, where it runs as a single band between the 1 kb and 1.5 kb markers; Per lane then scales each lane's brightness to its own brightest band. The worked example below runs the same starter with every number spelled out.
Worked example
Open the PCR, multiplex & fusion sample project. It arrives loaded with pBR322 (4,361 bp, circular) and primers designed against the record's own tet and bla genes — nothing is typed in.
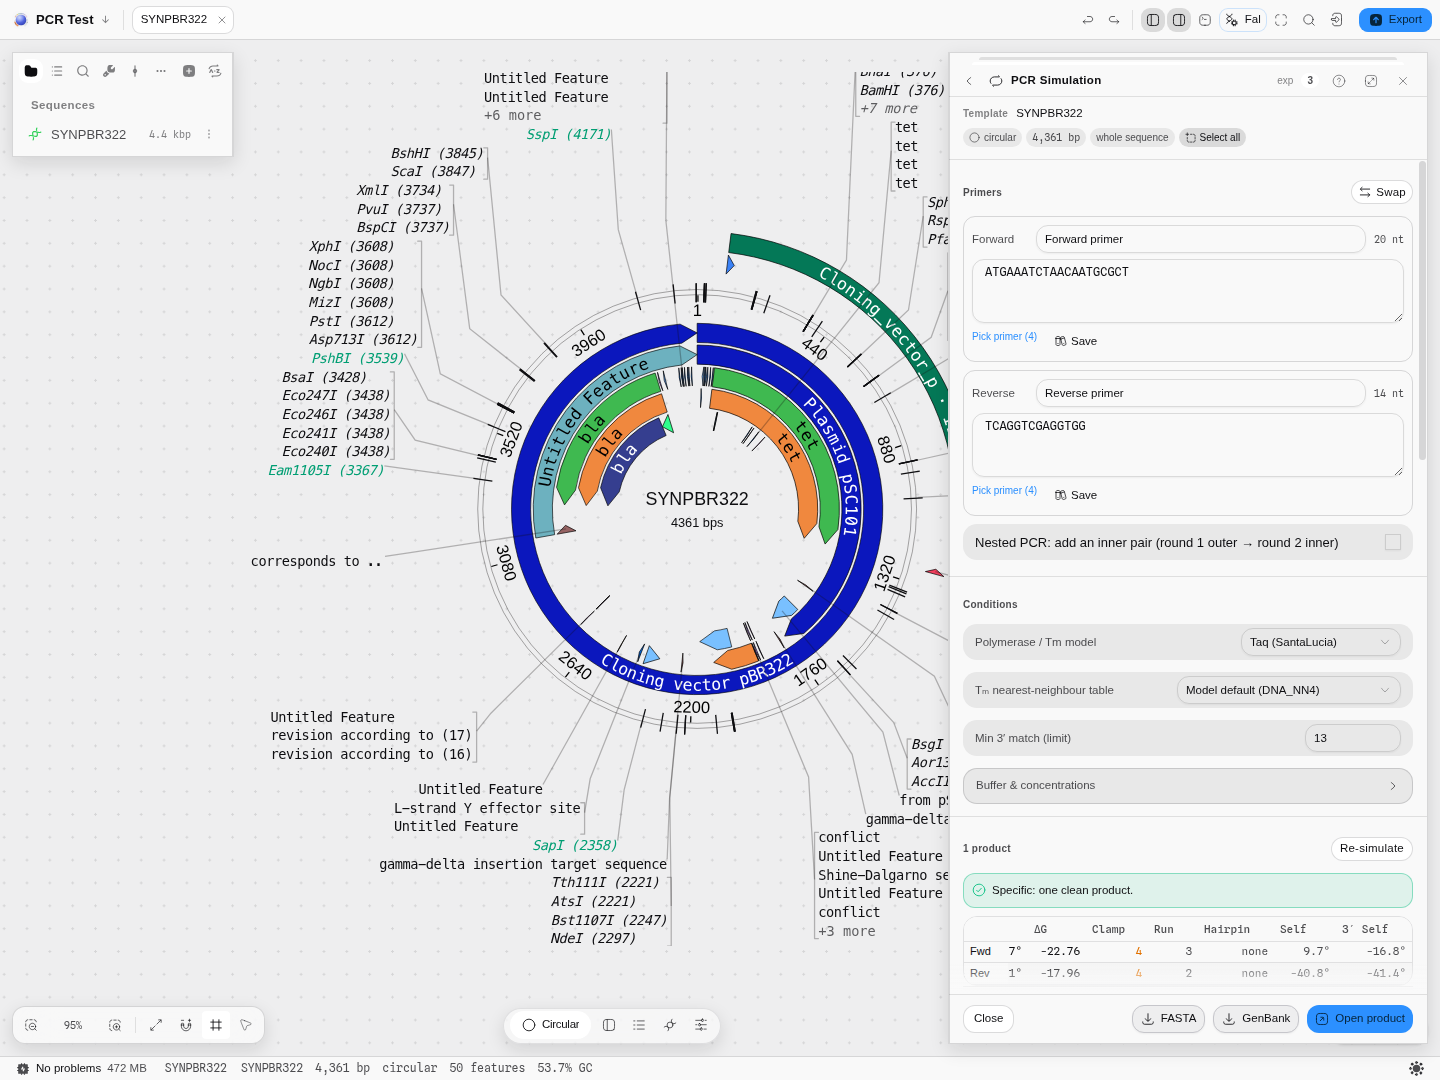
Press Simulate PCR with the seeded tet pair:
Forward tet_F | ATGAAATCTAACAATGCGCT, 20 nt, 35% GC, Tm 55.7 °C |
Reverse tet_R | TCAGGTCGAGGTGG, 14 nt, 64.3% GC, Tm 54.1 °C |
| Verdict | Specific: one clean product |
| Product | 1,191 bp, 61.5% GC, product Tm 84.6 °C |
| From template | 86–1276 — the tet CDS exactly |
| Annealing temperature | 60.5 °C for Taq, 57.1 °C for a Phusion/Q5-class enzyme |
| Features carried | 10 |
The suggested programme that follows from it: 95 °C for 3 min, then 30 cycles of 95 °C 30 s / 60.5 °C 30 s / 72 °C 53 s, a 5 min final extension and a 4 °C hold. The 53 s is derived from the 1,191 bp product and the polymerase's rate, not chosen.
Now replace the forward primer with something that is not in the molecule — GGCCTTAAGGCCTTAAGGCC —
and re-simulate. You get No amplification. Forward anneals 0×, reverse 1×., the quality table
stays, and the amplicon disappears from the map.
Controls
Template. Circular or linear (read from the record), and whole-sequence or the current selection.
Primers. Name and sequence for each, a Swap that exchanges them, per-field pickers into the project's primer library and a Save back into it. The length is shown as you type.
Nested PCR. Adds an inner pair. Round 1 runs the outer pair on the template; round 2 runs the inner pair on round 1's product, which is the point — a nested design is only as specific as the second round, and this shows you the second round's product rather than assuming it.
Polymerase / Tm model. Taq (SantaLucia) or Phusion / Q5 (DBD). This is not cosmetic: it changes both the melting-temperature convention and the annealing temperature derived from it, and the panel shows both annealing temperatures side by side so the difference is visible rather than hidden behind the choice.
Tm nearest-neighbour table. Independent of the polymerase above — see Algorithms you can choose. ΔG, ΔH and ΔS follow the same table, so a row never mixes two models.
Min 3′ match. How many bases at a primer's 3′ end must match before the site counts as annealing. Lower it to see the marginal sites a real reaction sometimes uses; raise it for a stricter prediction.
Buffer and concentrations. Na⁺, Mg²⁺, dNTPs and primer concentration. These are the salt conditions every melting temperature on screen is computed in, and changing them moves the annealing temperature as well as the Tm — which is the whole reason they are exposed. Mg²⁺ is corrected for dNTP chelation, so raising dNTPs above Mg²⁺ removes the divalent contribution.
Mismatches allowed. How many substitutions a primer may carry and still prime. Zero is the default, and zero means an exact match — the classic simulation, where a single wrong base means no product. Raise it when you are amplifying from a related strain, from a degenerate site, or with a primer you already know is imperfect, and the panel will find the sites a real reaction would use.
Two things about it are not adjustable by accident, because they are the biology:
- The 3′ end must pair exactly, however large the budget. A polymerase extends from a matched 3′ terminus; a primer mismatched at its last base does not prime, no matter how well the rest of it binds. 3′ bases that must pair sets how much of the end is protected — three by default. This is why raising the budget will never rescue a primer whose problem is at its 3′ end, and that is the correct answer rather than a limitation.
- Substitutions only. A mismatch is a wrong base, not a missing or extra one.
Every binding site then reports how many bases mismatched there, in the site list and on the map, so you can see which sites the allowance bought rather than only that it bought some. And a mismatched footprint's Tm is the mismatched duplex's Tm, not the number it would have had if it matched: one internal substitution takes a typical 20-mer from about 58 °C to about 53 °C, which is often the difference between a pair that works at your annealing temperature and one that does not. Degenerate primers (N, R, Y…) are refused while the budget is above zero rather than being matched as literal letters.
Draw on the map and Primer binding sites — two independent switches for the two kinds of mark, because on a dense plasmid you often want the products without the noise of every site.
Thermocycler programme. Family (the polymerase class, Taq by default), Steps (2-step, 3-step, or Auto, which picks from the primer Tms), Cycles (30 by default), and Touchdown with its own ΔT per cycle and cycle count. Touchdown starts the annealing steps above the target and walks them down: at −1 °C/cycle over 10 cycles the first cycle anneals at 70.5 °C and the tenth at 61.5 °C, then the main 30 cycles run at 60.5 °C. The header counts the total (40) so the touchdown block is not free cycles you forgot about. Copy programme puts the same table on the clipboard as text.
The reference diagram. Under the planned programme sits the cycling diagram pydna prints for this amplicon, in the same ASCII form the library has always used, and it follows the polymerase family you picked. It is a second opinion, not a second copy: pydna derives its annealing step from its own rule, and for a Phusion/Q5-class enzyme from a different melting-temperature function altogether, so on a 3,002 bp product at 29% GC the planned programme anneals at 62.4 °C while the reference diagram says 59.0 °C. Neither number is wrong — they are two published conventions, and seeing them side by side is the point. Anneal low if the pair is your only chance at a difficult template; anneal high if specificity matters more than yield. Copy pydna diagram puts the ASCII block on the clipboard for a lab notebook.
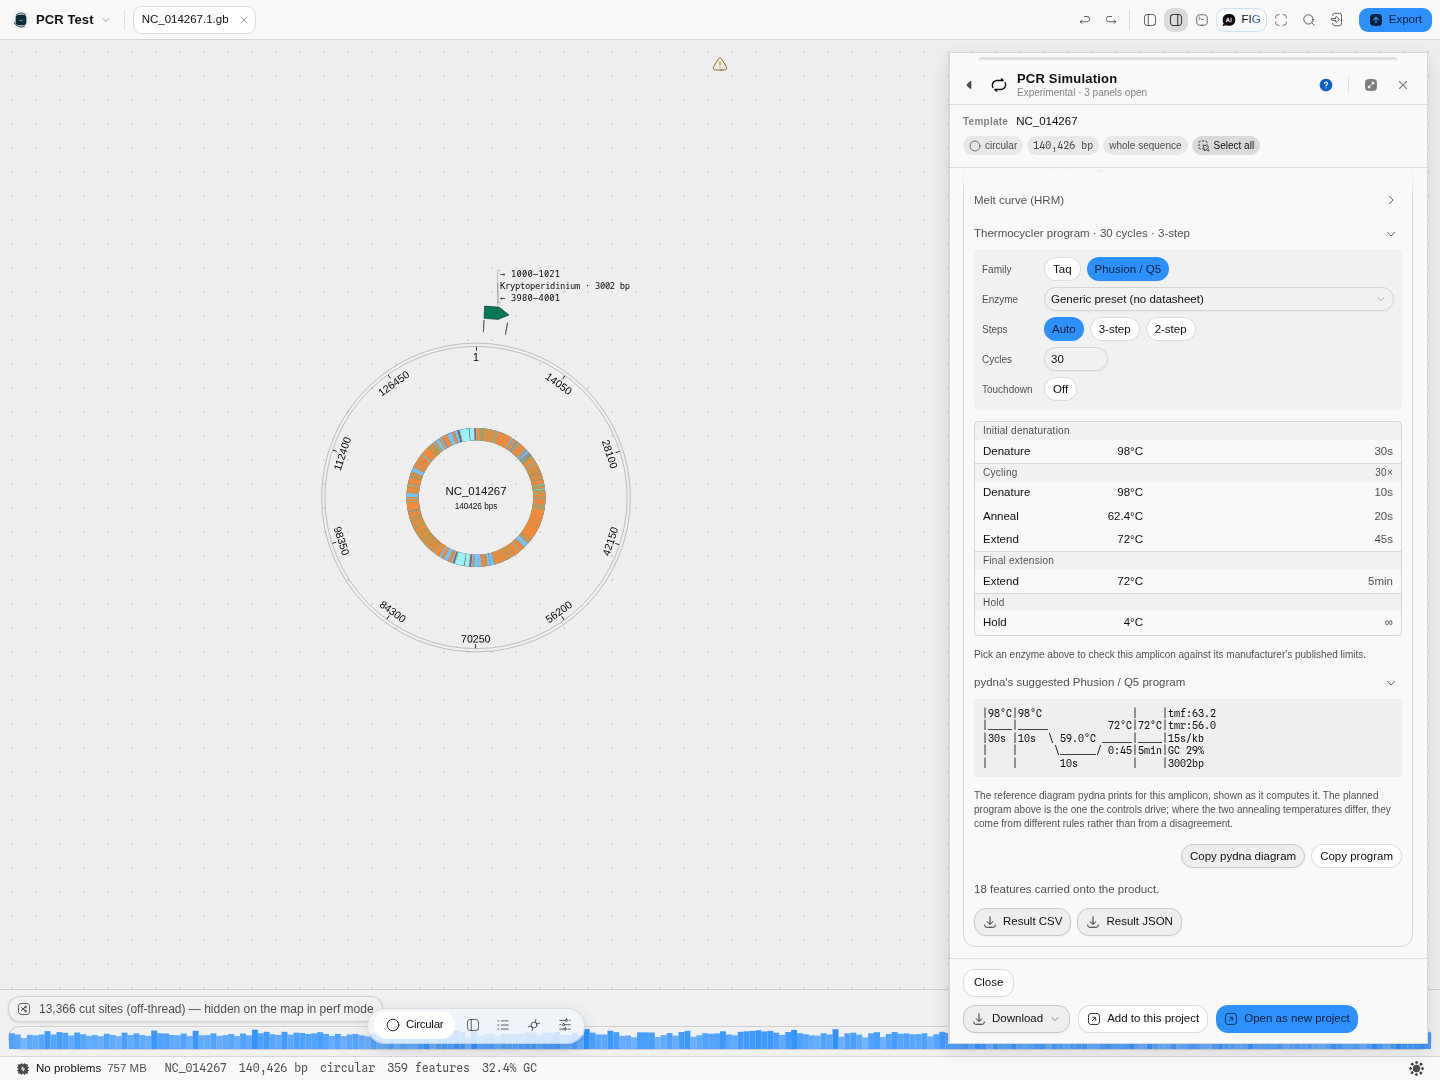 Two annealing conventions for one amplicon, on a complete 140 kb chloroplast genome.
Enzyme. Beside the polymerase family sits a catalogue of real, named products, each carrying its manufacturer's own published specification. Picking one does three things: it takes the extension rate for the programme from that product's datasheet rather than from a generic constant (5 s/kb for a fast premix, 60 s/kb for wild-type Taq); it takes the denaturation step — temperature and time, and the opening step where the manual states one — from that product's own protocol; and it opens the Reaction check below.
The panel names which numbers came from where, in a line under the picker, because the two sources are genuinely different in status. A manufacturer's protocol usually offers two denaturation temperatures ("5–10 sec at 98 °C or 20–30 sec at 94 °C" is the common form) and the programme takes the first, at the slow end of its seconds: budgeting the fast end of a range under-denatures on a slower cycler, which is what the range is describing. Annealing never comes from the enzyme — it comes from your primers, through the Tm model above. And two of the catalogued products carry no denaturation at all, because their manufacturer publishes it in a handbook this app cannot fetch; the line says so, and the family preset supplies the step in the meantime.
What the family still decides is the annealing convention, and the opening step. The two controls are independent — the family is the annealing convention, the enzyme is the datasheet — and with an enzyme picked the family no longer supplies the cycling denaturation. It does still supply the opening denaturation for products whose manual states none, so a plan can legitimately open at the preset's 95 °C and cycle at the manufacturer's 98 °C. That pairing is the vendor's own: Takara's guidance for its PCR polymerases is "denature at 94 °C for 10–30 sec. or at 98 °C for 1–10 sec.", and where a manual gives an opening step of its own — Terra Direct's 98 °C for 2 min, which its manual says is required to denature the hot-start antibody — the programme takes that instead.
Reaction check. Four numbers and a list of findings, all about this amplicon on this enzyme: the product as a percentage of the manufacturer's stated maximum, the extension time its published rate implies, the base substitutions expected per product molecule, and the fraction of molecules that should therefore be error-free. Every finding quotes the sentence it rests on, so nothing in the block is this tool's opinion about someone's enzyme. See Choosing a polymerase.
RT-PCR. Appears only when the open record declares a spliced transcript. See RT-PCR on a spliced template.
Algorithms you can choose
Melting temperature. The default is the nearest-neighbour model the reaction's own convention pins — the unified SantaLucia table for Taq, the Allawi/SantaLucia table for the DBD convention — and that default is what makes the simulator's numbers agree with the Primer Designer's. Four published tables are selectable when you need to match a number from a paper or another tool:
| Table | Citation |
|---|---|
| Breslauer 1986 | Breslauer et al. 1986, PNAS 83 |
| Sugimoto 1996 | Sugimoto et al. 1996, NAR 24 |
| Allawi & SantaLucia 1997 | Allawi & SantaLucia 1997, Biochemistry 36 |
| SantaLucia & Hicks 2004 (unified) | SantaLucia & Hicks 2004, Annu Rev Biophys 33 |
Changing the table moves every Tm, ΔG, ΔH and ΔS on screen together, and the citation for the active one is shown beneath the selector so a number you copy out stays attributable.
Annealing temperature. Two conventions, and they answer different questions. The Taq one is the classic primer-Tm-based rule; the DBD one is the model appropriate to double-strand-binding-domain enzymes such as Phusion and Q5, where the product length enters the calculation. Both are shown for every product, so switching polymerase is a decision you make with both numbers in front of you.
Hairpin and dimer energies. One model, primer3's thermodynamic alignment, run on the oligos as entered including any 5′ tail. There is no second option here because there is no second accepted answer; what the panel does instead is show the limits it is judging against.
A note on what you will not see: the underlying calculation can return a melting temperature far below zero — sometimes below absolute zero — for a structure so weak it is arithmetic rather than chemistry. Those read as none, because a structure that melts below 0 °C does not exist at any temperature your reaction runs at. The exact figure is still there on hover if you want it.
Choosing a polymerase
The enzyme is not a detail you settle after the primers. It decides four things this panel can check for you, and a fifth it can only report.
Length. Every manufacturer publishes a maximum amplicon, measured on genomic DNA, and they differ by more than an order of magnitude: 2 kb for wild-type Taq, 8.5 kb for a mid-range high-fidelity enzyme, 30 kb for a long-range one, 50 kb for the longest catalogued here. Ask for more than the published figure and the check refuses with the specification line quoted. Ask for less and it tells you how much of the budget you are using, as a percentage, and stops there. There is deliberately no "approaching the limit" warning, because nobody publishes the fraction of a maximum at which a reaction starts to fail, and a threshold invented for that would fire on reactions that work.
GC. Manufacturers state a supported GC range, and it is narrower than most people assume: 40–60% for wild-type Taq, 35–65% for one very-high-fidelity premix, up to 73% or 75% for the GC-tolerant enzymes, and up to 90% for one long-range enzyme with its GC buffer — a qualifier the check reproduces, because the plain buffer does not reach it. A product outside the range is flagged with the vendor's own number, so the fix is the one the manufacturer suggests rather than folklore.
Fidelity, and this is where most published numbers are not comparable. An enzyme's error rate moves by up to three orders of magnitude with reaction conditions, particularly dNTP and magnesium concentration, which is why fidelity is conventionally quoted relative to Taq rather than absolutely. This tool therefore does not mix manufacturers' claims. It carries one study that assayed nine polymerases under a single single-molecule sequencing protocol, and uses those rates:
| Polymerase | Substitutions per base per doubling | Relative to Taq |
|---|---|---|
| Q5 | 5.3 × 10⁻⁷ | 280× |
| Deep Vent | 4.0 × 10⁻⁶ | 44× |
| Phusion | 3.9 × 10⁻⁶ | 39× |
| Pfu | 5.1 × 10⁻⁶ | 30× |
| PrimeSTAR GXL | 8.4 × 10⁻⁶ | 18× |
| KOD | 1.2 × 10⁻⁵ | 12× |
| KAPA HiFi HotStart | 1.6 × 10⁻⁵ | 9.4× |
| Taq | 1.5 × 10⁻⁴ | 1× |
| Deep Vent (exo-) | 5.0 × 10⁻⁴ | 0.3× |
From that rate the check computes what you actually want: the expected number of substitutions in one molecule of your product — the rate times the product length times the number of doublings. A 3 kb amplicon over 30 cycles carries 13.5 expected substitutions on Taq and 0.76 on PrimeSTAR GXL, so roughly one clone in a hundred thousand is clean in the first case and about half are clean in the second. That is the number that decides how many colonies you screen. Doublings are counted as cycles, which is the worst case: a real reaction is under 100% efficient and doubles fewer times than it cycles.
Where an enzyme was not in that study, the check says so rather than substituting the manufacturer's own rating. Those ratings are ordinal house scales, "four pluses out of five", and two manufacturers' scales are not the same scale, so they are shown as what they are and never converted into a number or compared across brands.
Proofreading and the ends you get. An enzyme without a 3′→5′ exonuclease never corrects a misincorporation, which is the right trade for a genotyping or diagnostic amplification and the wrong one for anything you will clone and express. And the product's ends decide the next bench step: a Taq-family enzyme leaves 3′ dA overhangs, ready for TA cloning and needing polishing before a blunt ligation or a Gibson junction; a proofreading enzyme leaves blunt ends, ready for Gibson, SLIC and In-Fusion and needing an A-tailing step before TA cloning. Both are reported for every enzyme, from its own specification.
What it cannot tell you: yield. Relative product abundance needs per-enzyme kinetics — processivity, Km, per-cycle efficiency — and no manufacturer publishes them. Where two products are both possible they are both listed, unranked, and that is the honest answer rather than an invented one.
RT-PCR on a spliced template
If the record you have open declares its transcripts — a GenBank mRNA or CDS whose exons are
given as a joined location — the panel runs your pair against the spliced molecule as well as
the genomic one, and answers the question an RT-PCR assay is designed around: would contaminating
genomic DNA give you a band?
Three things change once the template is spliced:
- A primer straddling an exon junction exists only on the transcript. It cannot prime on genomic DNA at all, which is the standard way to make an assay blind to gDNA contamination.
- A spliced product maps back to several genomic intervals, not one. Drawing it as a single span from first base to last would paint the introns it did not amplify.
- The same pair on both templates is the diagnostic. If it amplifies genomic DNA too, a contaminated RNA prep gives a band — and whether you can see that on a gel depends on whether an intron sits between the primers.
Walking through it
The sample project opens with the human EMX1 locus, which declares two transcript variants of three exons each.
-
Open the EMX1 record, then Tools → PCR Simulation. The RT-PCR section appears and says how many spliced transcripts the record declares — four here, because both mRNA variants and both coding sequences are joined.
-
Pick a transcript in the Transcript list (default Genomic only (no splicing)). It names each by type and spliced length (EMX1 mRNA · 3 exons · 2,166 bp, EMX1 CDS · 3 exons · 360 bp, …), because a gene's variants share a name and the length is what distinguishes them.
-
Enter a pair that crosses a junction and press Run on transcript + genomic. The readout gives the transcript length, how much intron was removed (16,537 bp for the long variant), whether a primer spans a junction, and whether genomic DNA would amplify. The junction verdict names the primer rather than saying "yes": Forward, Reverse or Both. Under it, a line per primer says where that oligo binds on the transcript and which junction it straddles, counted and placed — straddles junction 1 of 2 (transcript 876 · genomic 9,121) — so you can find the junction on the map instead of taking the verdict on trust.
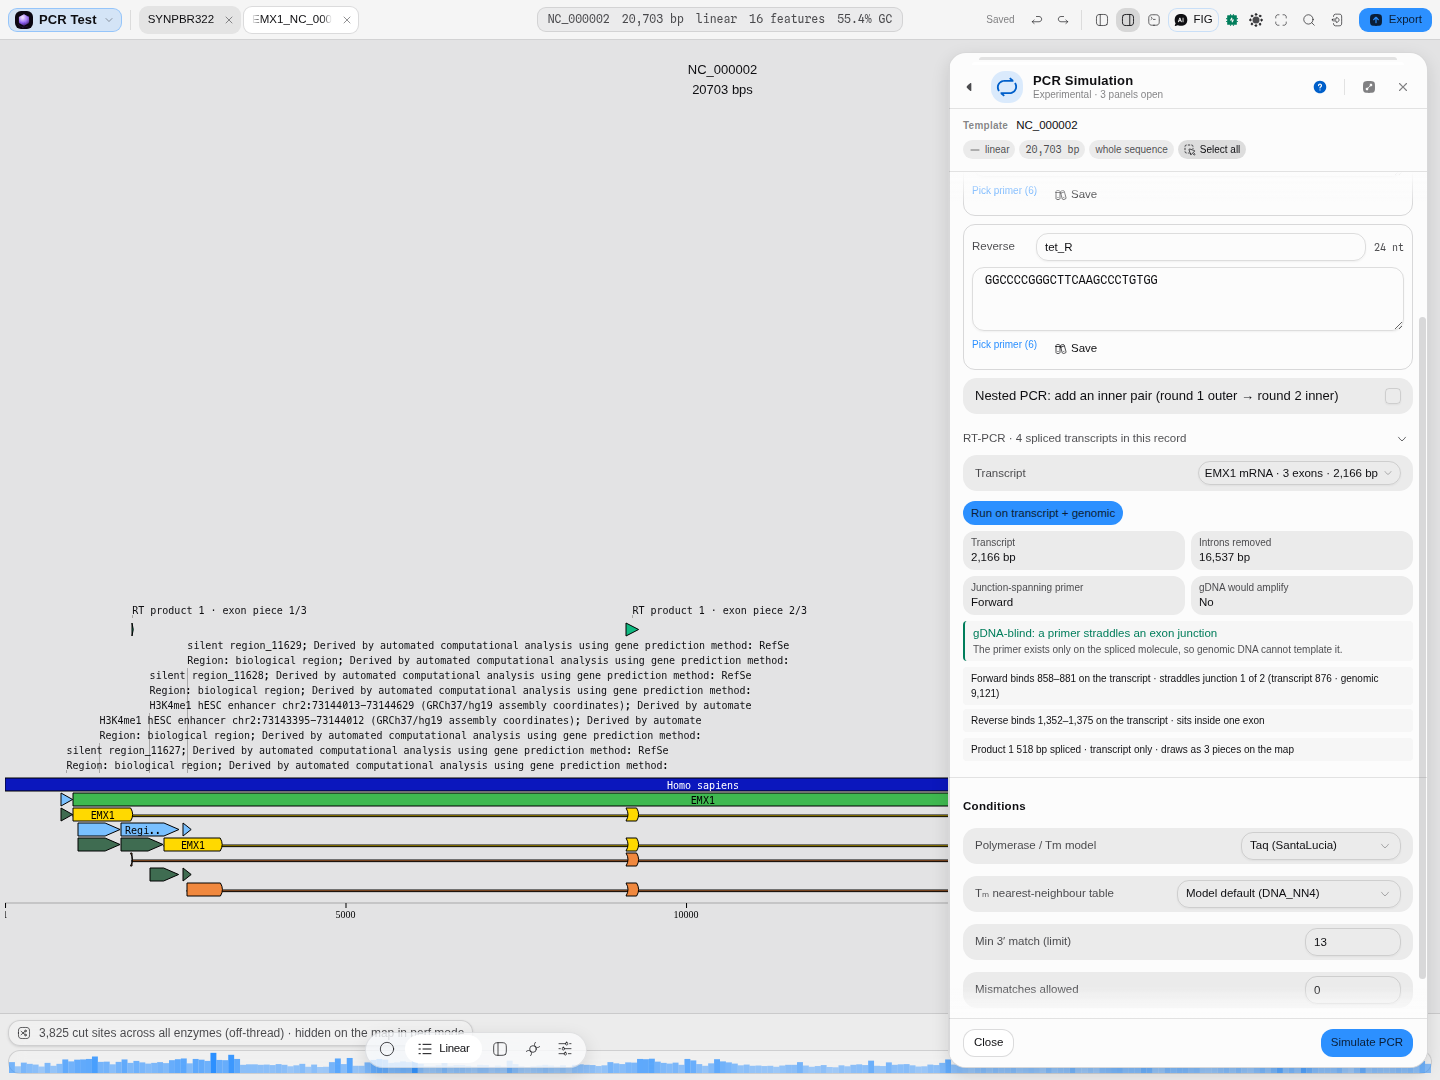 A gDNA-blind assay. The 518 bp product is drawn as three marks, one per exon it touches.
-
Read the map. The product's genomic pieces are drawn separately and labelled exon piece 1/3, 2/3, 3/3. That is the amplicon's real footprint on the chromosome; the introns between the pieces are not part of it.
-
Now try a pair inside one exon, the mistake this section exists to catch. The verdict becomes a warning, and it uses your numbers rather than a canned sentence: both primers sit inside one exon, so genomic DNA gives a product of the same size, and a gel cannot separate the two at all.
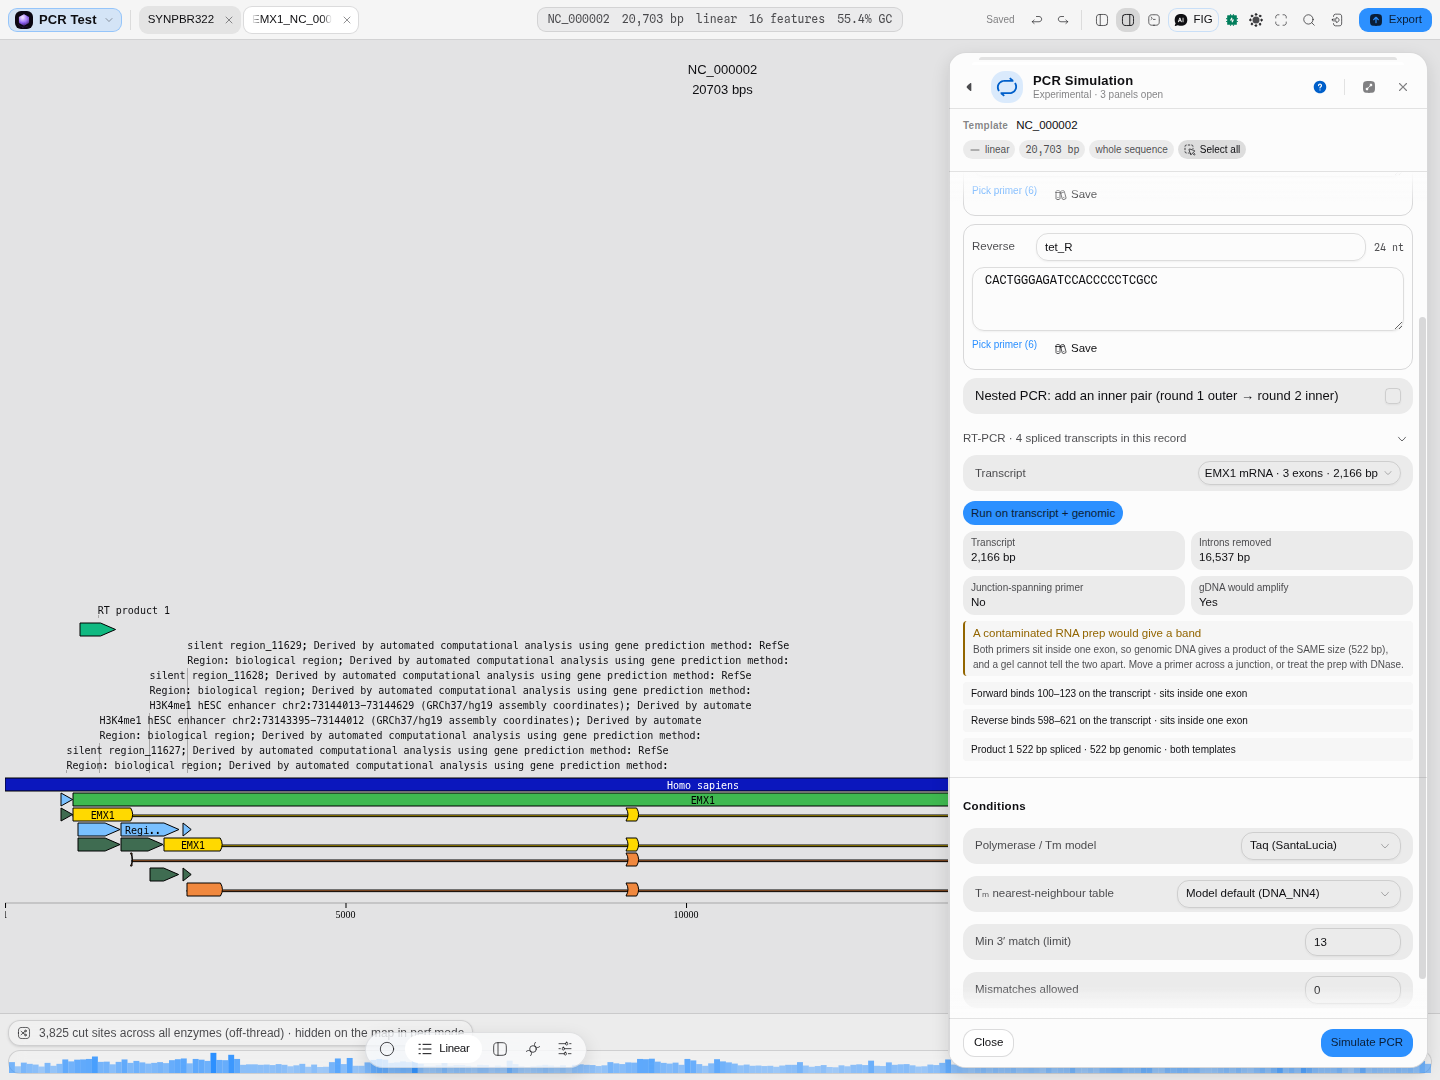 The failure mode. Same size means no gel can save you: move a primer across a junction, or DNase-treat the prep.
Where an intron does fall between the primers, the warning reads differently — it gives both product sizes and the intron length between them, because then the two bands separate and the larger one is your contamination readout.
Two things it does not do
It does not model reverse transcription: the transcript is the spliced sequence the record declares,
so RT efficiency, priming strategy and RNA secondary structure are outside it. And it will not
splice a joined feature that is not an mRNA or a CDS — a joined misc_feature means whatever
its author meant, and splicing on it would be a guess.
The science
A primer anneals where its 3′ end matches; how far back the match must extend before the polymerase can extend from it is the parameter you control. The simulator finds those sites exhaustively on both strands — not by string search on the primer as a whole, which would miss every tailed primer — and then asks which pairs of sites face each other with the forward one upstream. On a circular template "upstream" wraps, which is why the origin-spanning product comes out right.
The product is then built by cutting the template, not by concatenating primers: the amplicon carries the template's bases between the two annealing sites, with each primer's non-matching 5′ tail added at its end. This is what lets the template's annotations be carried onto the product with correct coordinates, and it is why the product's feature table is real rather than decorative.
Melting temperatures are nearest-neighbour calculations over the published tables above, in the salt and oligo concentrations you set, with the standard corrections for monovalent and divalent cations and for dNTP chelation of Mg²⁺. The annealing temperature follows from the primer Tms by the convention the chosen polymerase implies. The extension time follows from the product length and the polymerase's rate. Hairpin, self-dimer and 3′-self-dimer energies come from a thermodynamic alignment of the oligo against itself, judged against primer3's own published limits.
The products gel
The gel below the result is the same instrument as the Virtual Gel Bench and the digest gel, with the same controls, because the question you ask of it is the same one: will I be able to tell these bands apart?
- Agarose % — the default places bands on a reference ladder's own measured curve. Pick one of the ten casting percentages (or Custom percentage… for the gel you actually poured) and the gel switches to a concentration model and states the window it resolves, which is the number that decides whether a 400 bp and a 500 bp product are two bands or one. A product outside the window is marked: it is still placed, but by extrapolation, so read its size from the table rather than off the gel.
- Model and Form — the mobility law and the DNA topology. An amplicon is linear, so the form matters here mainly when you are comparing an amplicon lane against a plasmid lane.
- Marker ladders and Calibrate — type in your own ladder, optionally with the
(bp, Rf)values measured off your own gel photo, and position the whole gel on your curve rather than a catalogue one. The refusals and the reasoning are described on the Gel Bench page. - Bands · Raster · Both — the measurable rectangles, the camera-like smear where close products merge into one band, or both together.
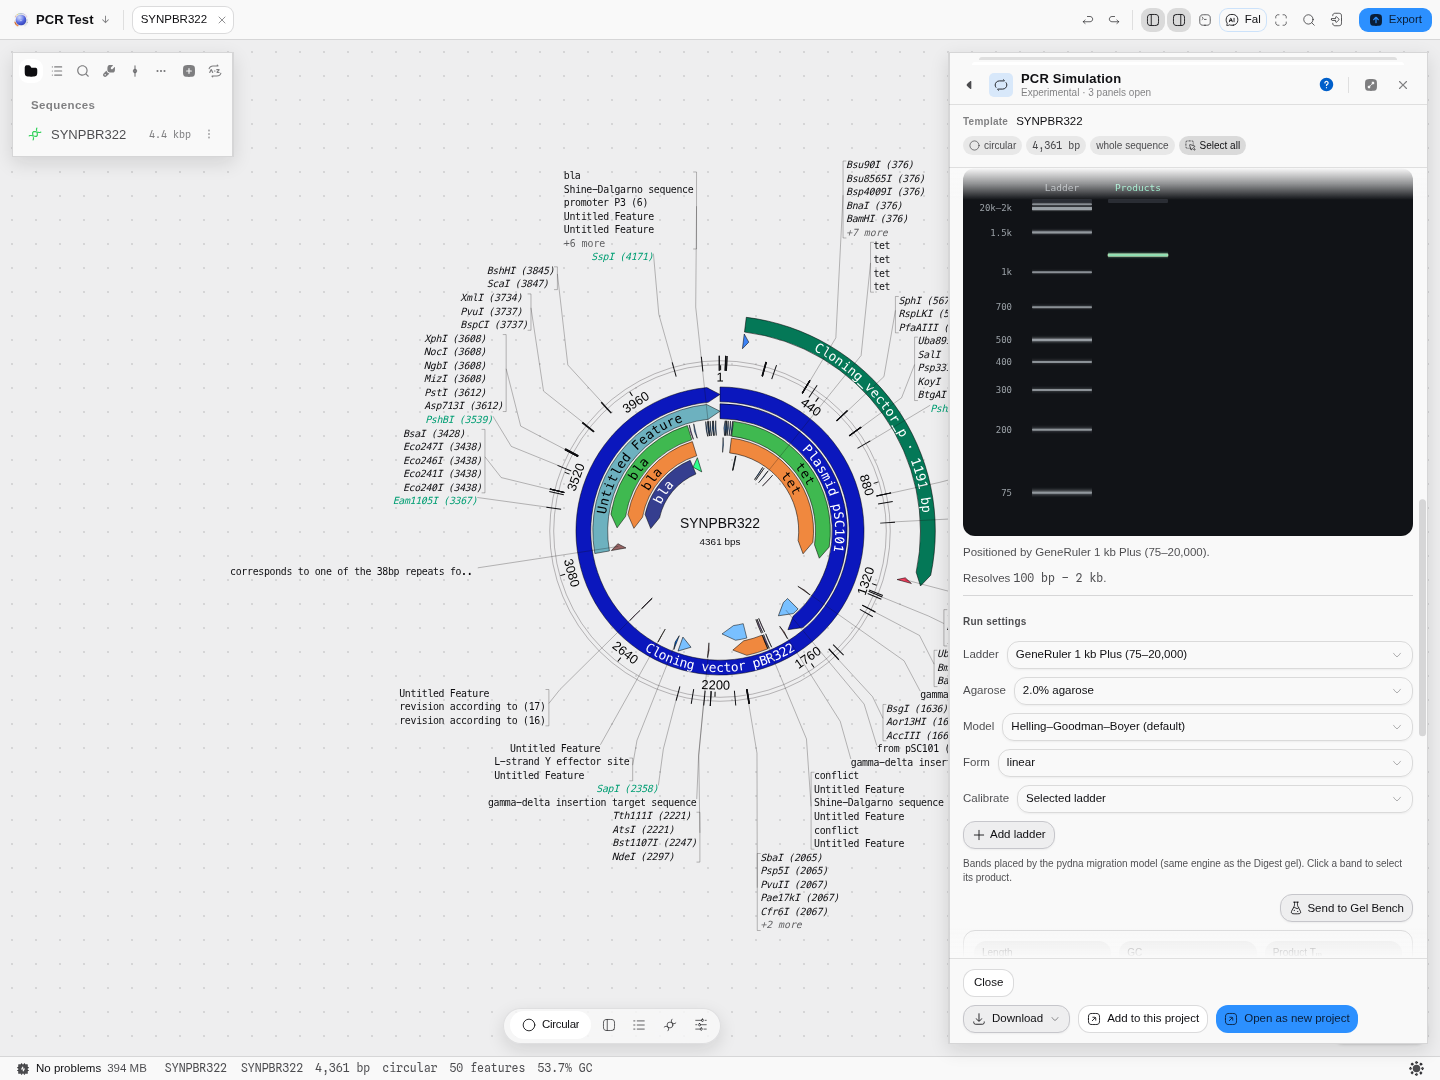 A 1,191 bp
tet amplicon at 2 % agarose beside the GeneRuler reference. The gel reports that it
resolves 100 bp – 2 kb, so this product sits inside the window; a 3 kb product here would be marked
as extrapolated. The gel is drawn above its settings, so the result stays in view while you
change the percentage — the same order the Gel Bench uses. The amplicon is simultaneously an arc on
the plasmid map.
Provenance of correctness. The reaction is verified byte-for-byte against pydna, the reference implementation of in-silico amplification, including the circular and origin-spanning cases. The melting-temperature and thermodynamic engines are verified against primer3 across its full test range. The virtual gel places bands by the same migration model the restriction-digest gel uses, so a PCR band and a digest band on the same ladder mean the same thing.
Shared with other tools: Melting temperature compares how every tool that does this chooses its method.
Limitations
- It is a thermodynamic and sequence model, not a kinetic one. It tells you what can amplify, not how much of each product you would get. Where two products are both possible it lists both without ranking them by yield. Relative abundance needs per-enzyme kinetics — processivity, Km, per-cycle efficiency — and no manufacturer publishes them, so a ranking would be invented rather than computed.
- Mismatch tolerance covers substitutions, not insertions or deletions. A primer that binds through a bulge — an extra base on one strand, or one missing — is still treated as not annealing. Substitutions are the case that matters for a primer designed against a related strain or a degenerate site, and they are modelled; a bulge is a different search.
- Very large templates run in the background. Above 100 kb the simulation moves off the main thread so the editor stays usable, and a Stop appears next to the run — the sample project carries a 140 kb chloroplast genome so you can watch it happen. Below that it is fast enough to be instantaneous — a 4 kb plasmid takes about a hundredth of a second.
- Polymerase failure prediction is limited to what manufacturers publish. Amplicon length against the stated maximum, GC against the stated range, extension time against the published rate, expected errors from a measured rate, proofreading and product ends are all checked. What is not checked is anything nobody publishes a number for: secondary-structure stalls, inhibitor tolerance, and the fraction of a maximum at which yield begins to drop.
- RT-PCR does not model reverse transcription. The spliced template comes from the exon structure the record declares, so junction-spanning primers, isoform choice and gDNA contamination are all answered; RT efficiency, priming strategy and RNA secondary structure are not.
- The melt curve is a prediction, computed from the product's sequence and the buffer — useful for asking whether two products would be distinguishable, not a substitute for running one.
Compared with other tools
Most sequence editors will show you a product for a primer pair. Two things here are less common: the reaction is validated against a published reference implementation rather than being a bespoke string search, and the unproductive binding sites are first-class output — the sites that annealed and made nothing are drawn on the map, which is where a second band comes from and is usually the information that is missing when a prediction disagrees with a gel.
Three more, added since: the enzyme is a named product with its manufacturer's published specification behind it rather than a two-preset toggle, and every check quotes the line it rests on; expected sequencing errors in your product are computed from a measured rate rather than left as a fidelity star-rating; and a spliced template is a real template, so an RT-PCR pair is judged as one instead of being run against the genomic sequence it was designed to avoid.
Against dedicated primer tools, this panel does less on designing a pair — that is Primer Designer's job — and more on interrogating a pair you already have against a specific molecule.
Export
The product leaves as FASTA or GenBank (with its carried features) from the footer's Download menu, or becomes a sequence you keep working on — in this project, as a new tab beside its template, or as a new project of its own. Both are real saved files with the same recorded lineage; the choice is only about where the work continues. Keep it here when the amplicon is an intermediate you are about to clone into something else, because the tools downstream read the open project's documents as their context. The whole run leaves as CSV or JSON — products, binding sites, primer quality and the conditions they were computed under. The thermocycler programme copies as text. The gel can be sent to the Gel Bench to sit beside other samples.
API
Not documented here. This page is about the method; the programmatic entry points live in the API section of the site.
Automation
The reaction is available to the workflow builder and to the copilot, so a pair can be checked against many templates without the panel. The thermocycler programme is too: give it an amplicon's length, its GC and the annealing temperature — all three of which an upstream amplification or primer design already reports — plus the enzyme you are using, and it plans the cycling and runs the same reaction check the panel shows, quoting the same specification lines. It is the step that goes after an amplification rather than a second way to do one, which is why it takes the product rather than the primers. Pooling decisions remain panel-only.
Provenance
Opening a product as a new sequence records where it came from — the template, the two primers and the conditions — in that sequence's history, so an amplicon in your project can be traced to the reaction that produced it rather than being an anonymous string of bases. The prediction itself is deterministic: the same template, primers and buffer give the same product and the same numbers.
Screenshots
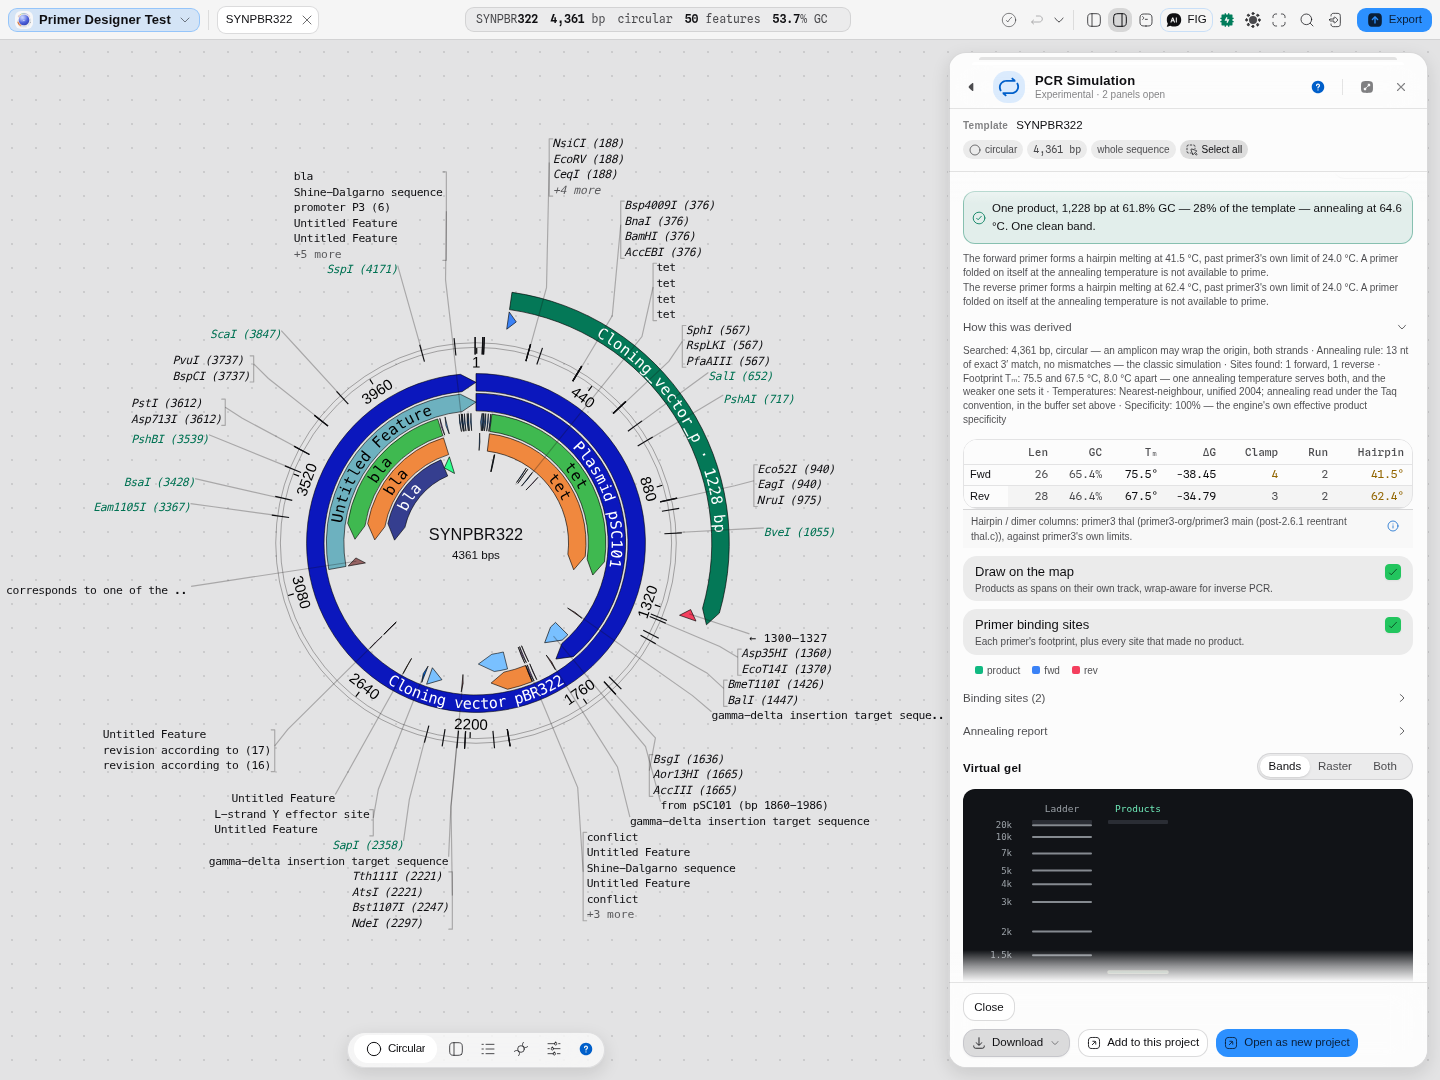 A pair picked by coordinate on the real pBR322 of the Primer designer starter: one product,
1,228 bp at 61.8% GC — 28% of the template — annealing at 64.6 °C, which is checkable, since
1,228 bp is simply the distance between the two primer positions. Both primers earn a hairpin
caution against primer3's own 24.0 °C limit (41.5 and 62.4 °C), the chain is open beneath, and the
amplicon is drawn on the map as the
1228 bp arc.
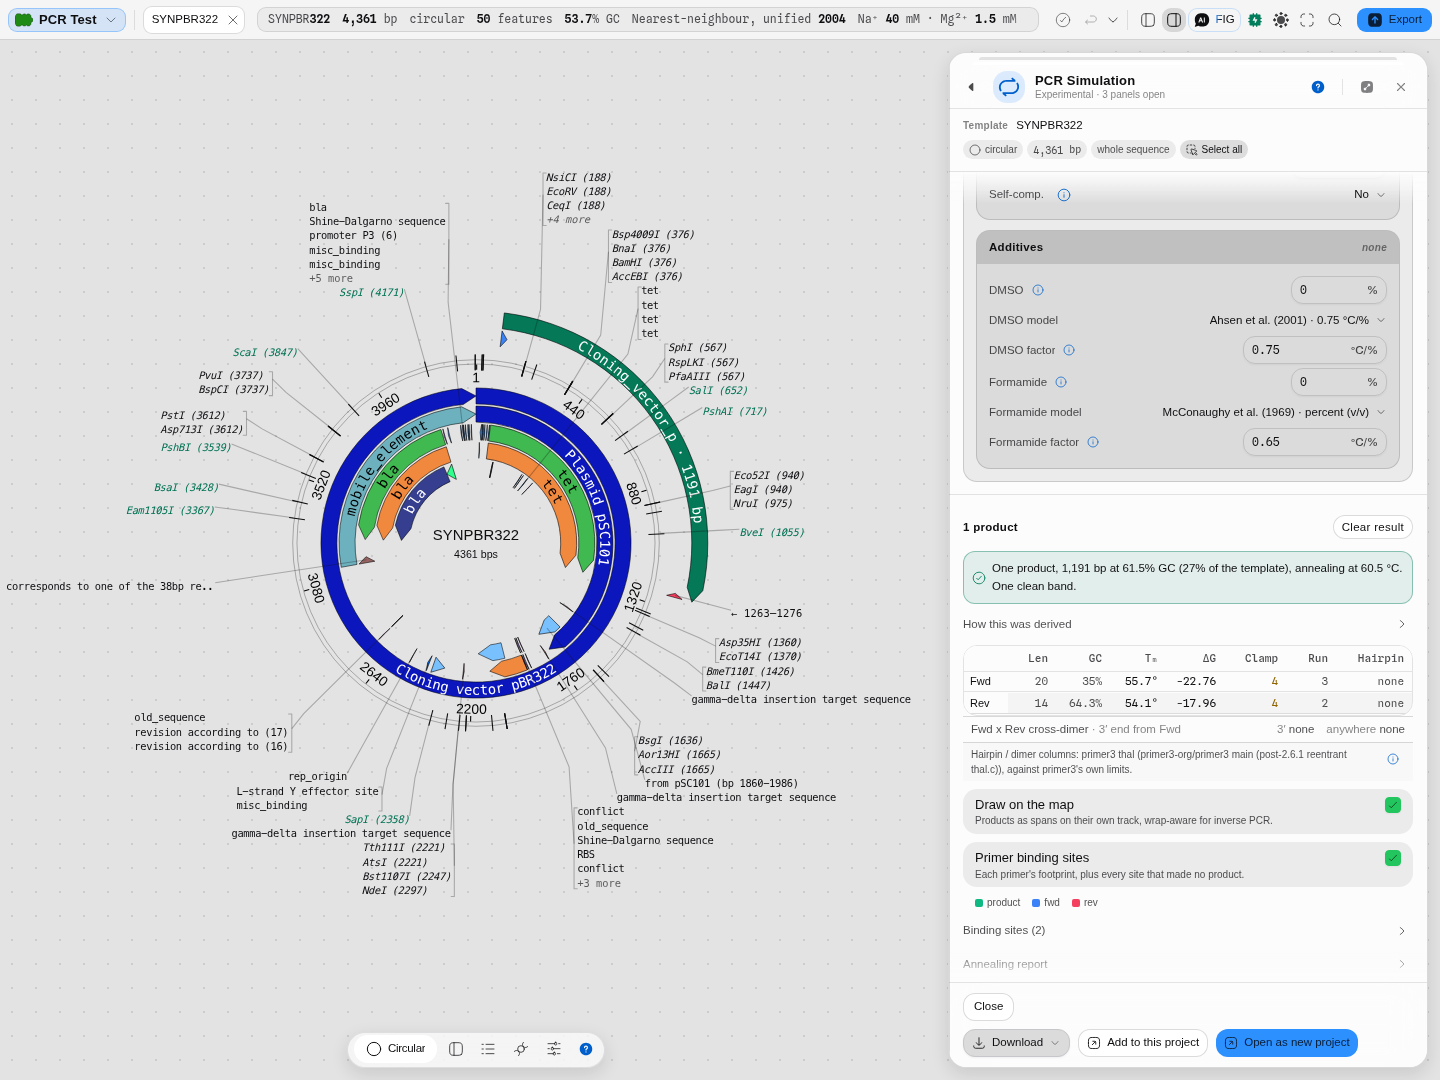 A specific reaction. The product is drawn where it happens, not only listed.
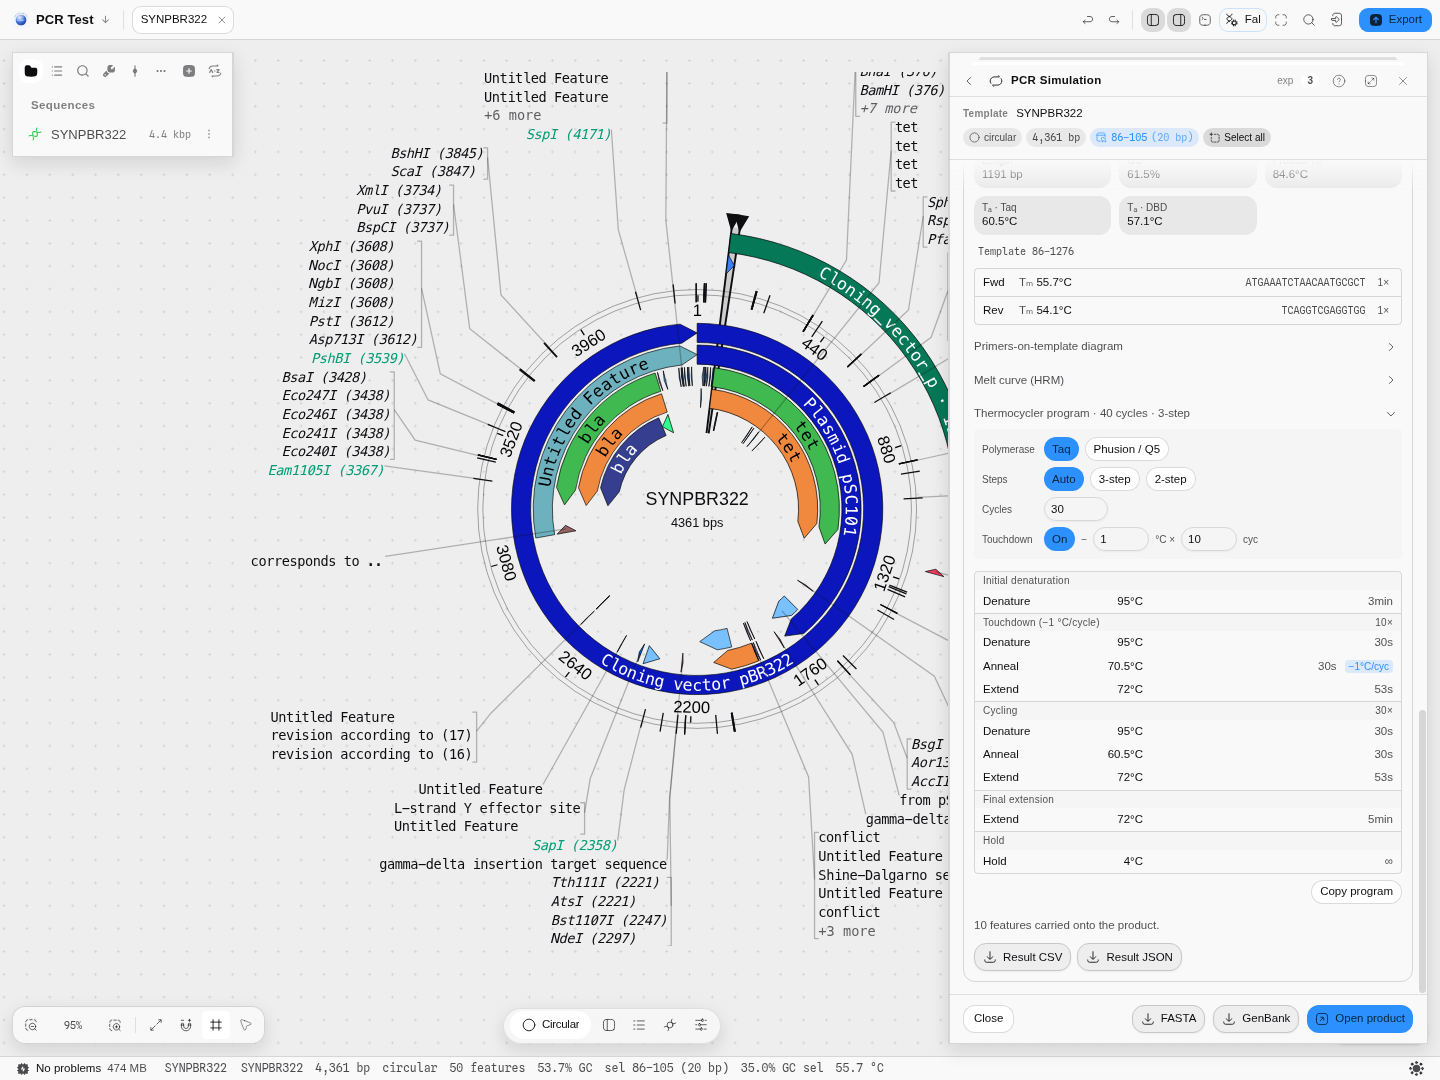 Touchdown, derived from this product's own annealing temperature.
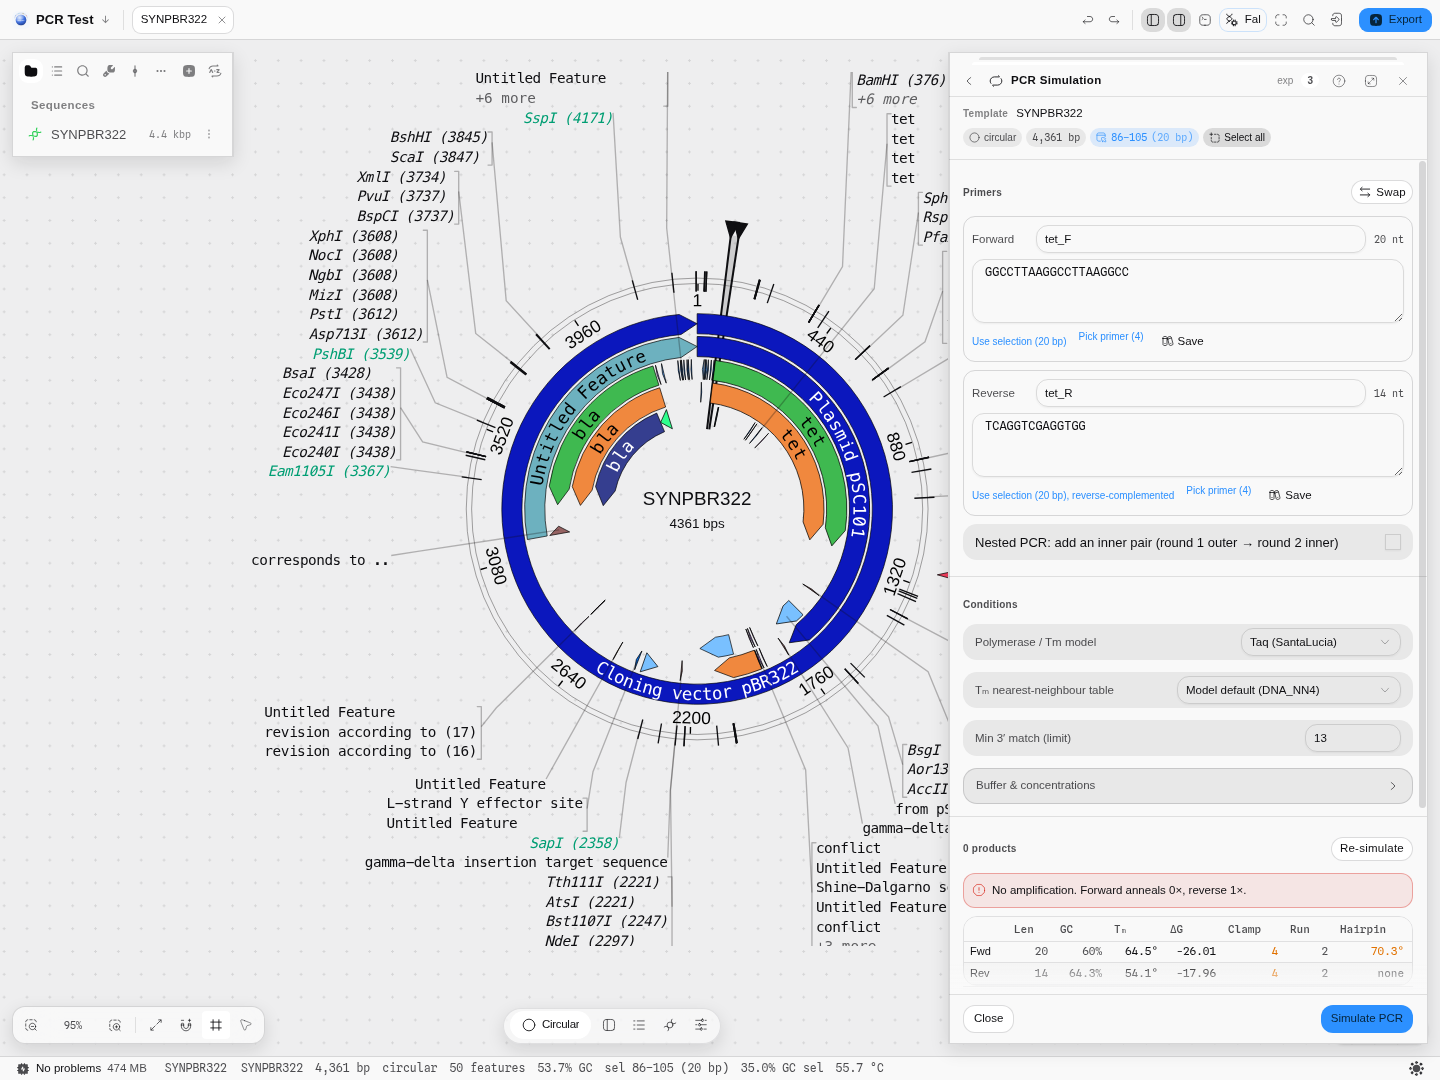 No product is a result. It names which primer failed and how.
 Nine measurements per primer, each judged against primer3's own limits.
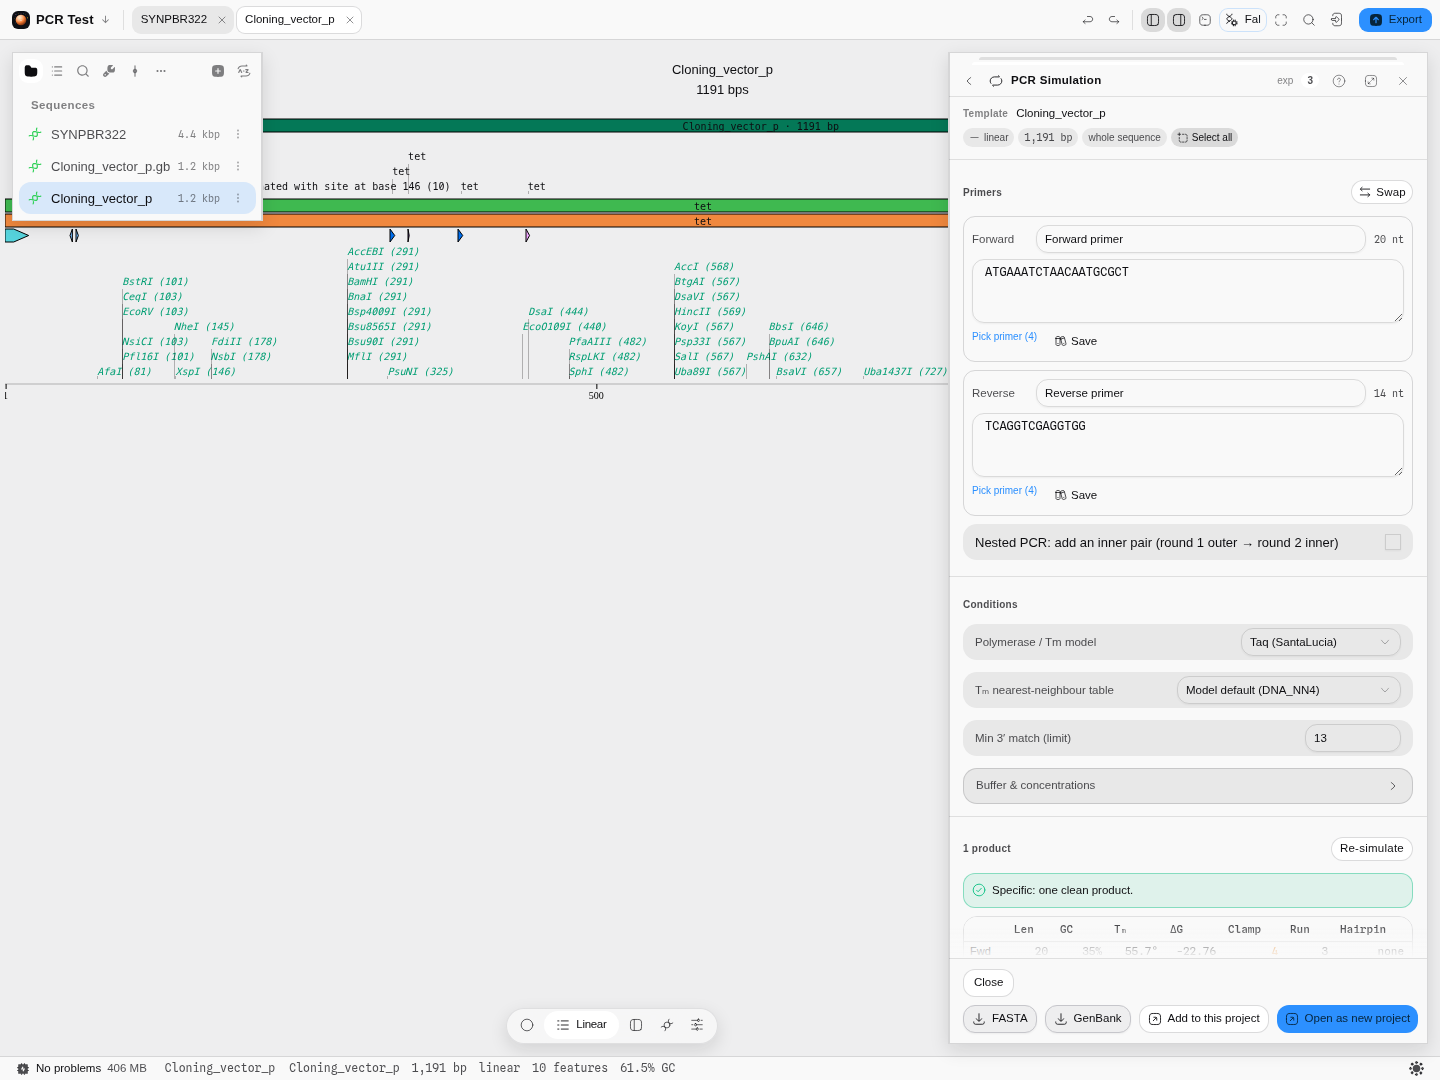 Keeping the product in the same project. The tools downstream read it as editor context from here.
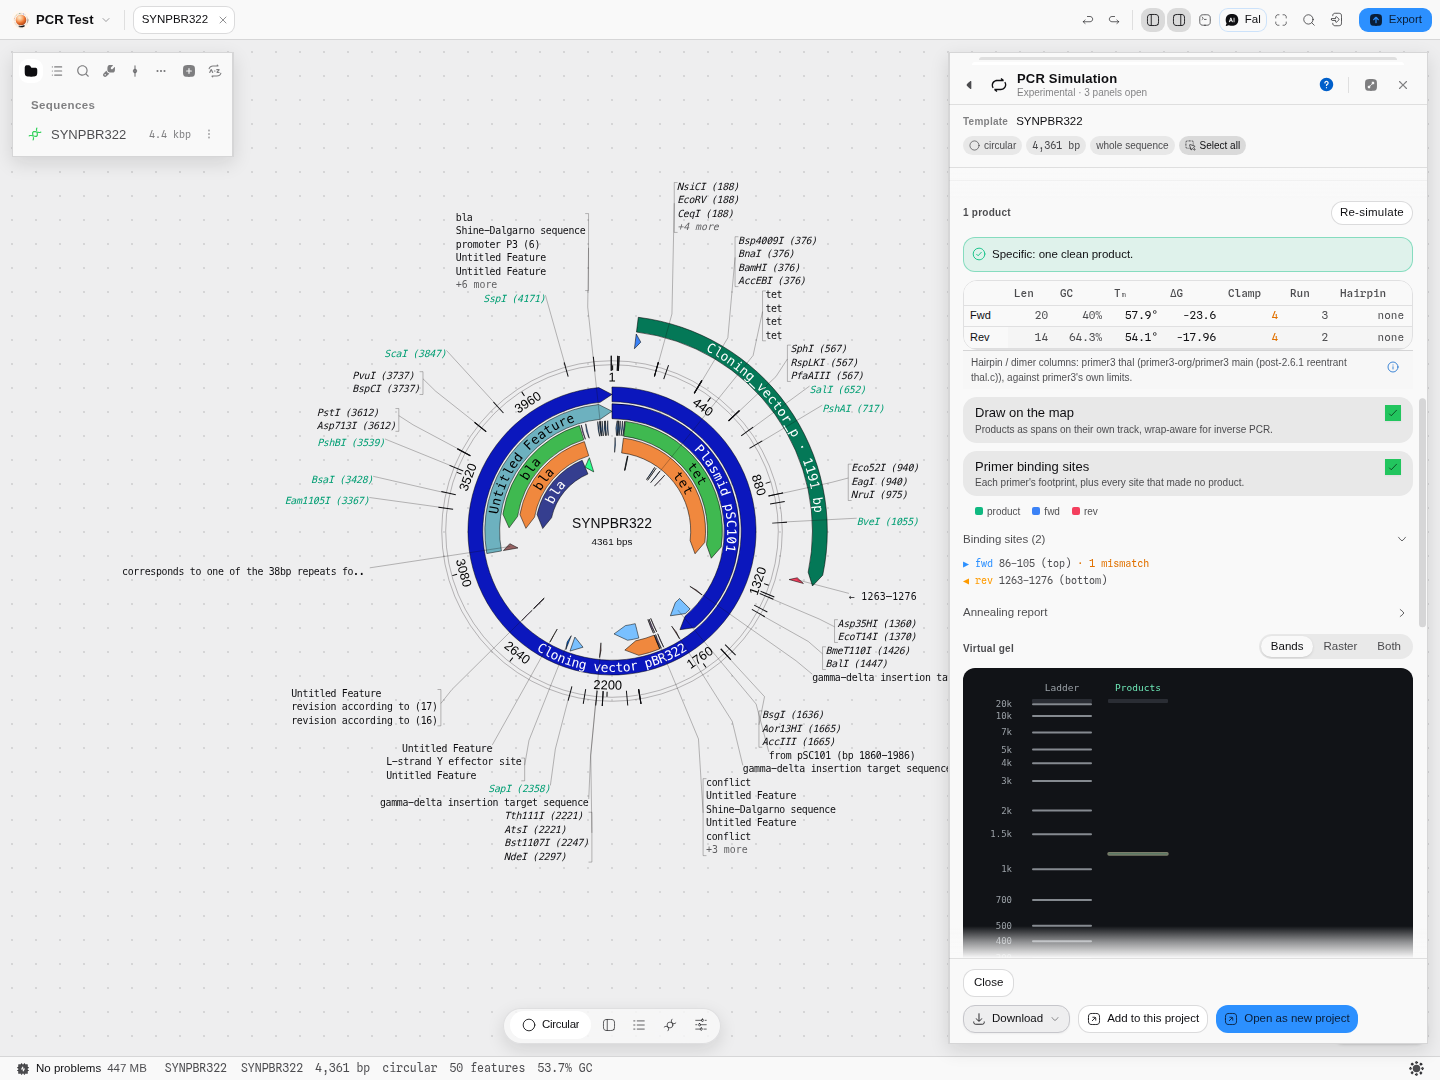 The same primer makes nothing at a budget of zero. Where the allowance was spent is on the site, not just in the verdict.
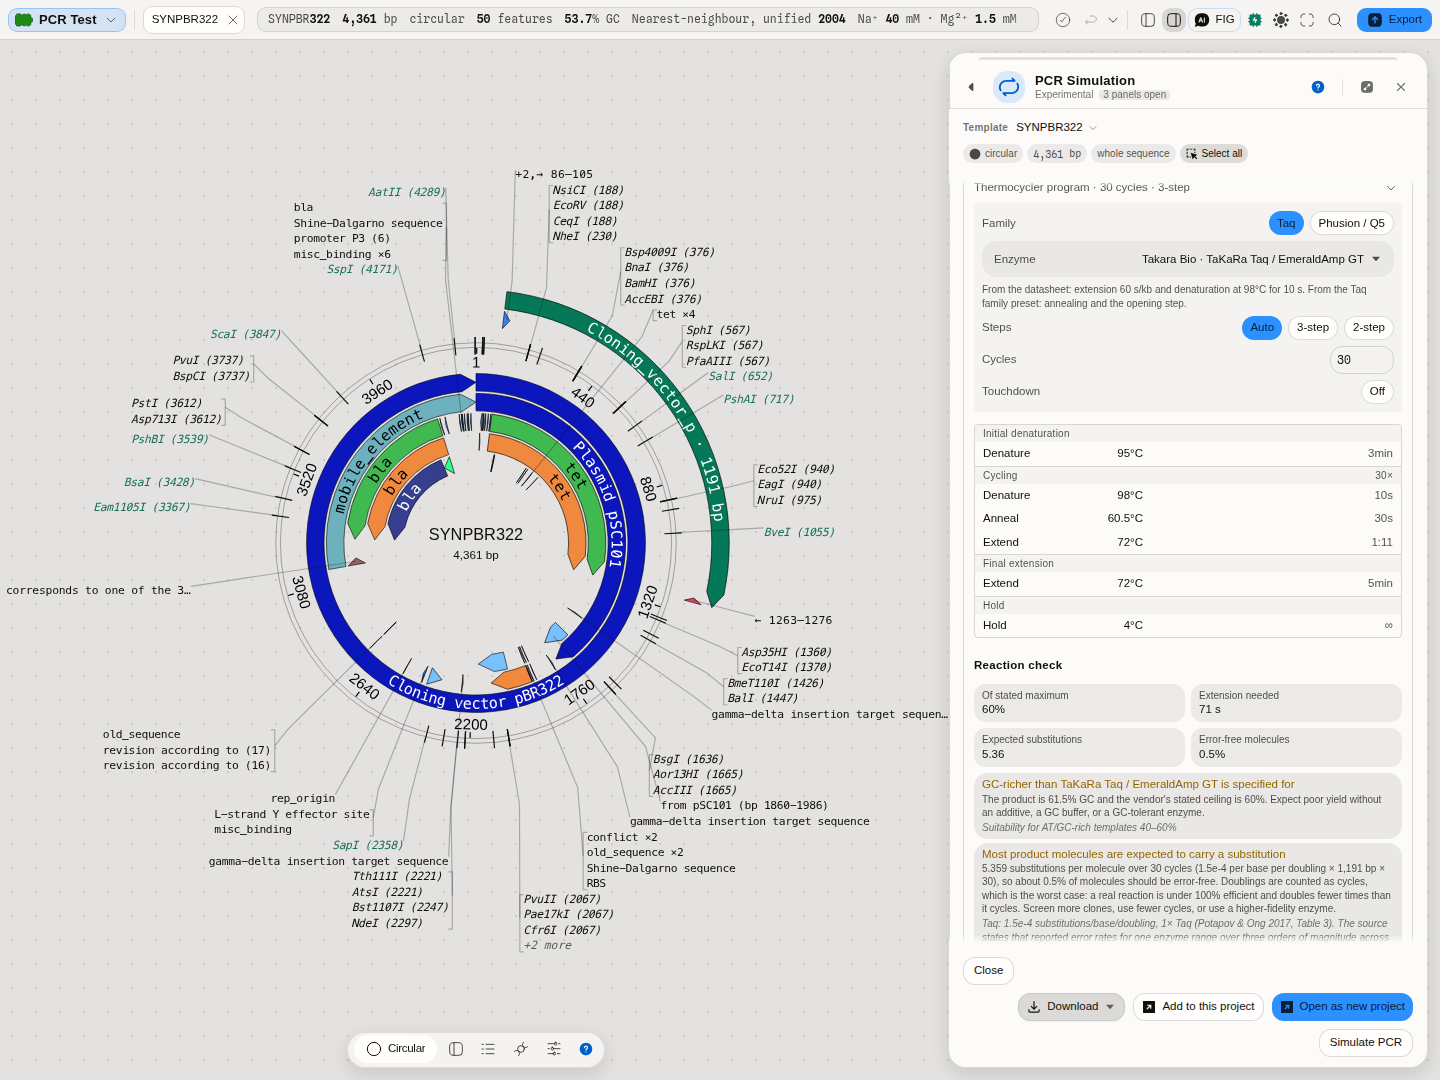 The enzyme's own datasheet driving the programme, and the reaction checked against it.
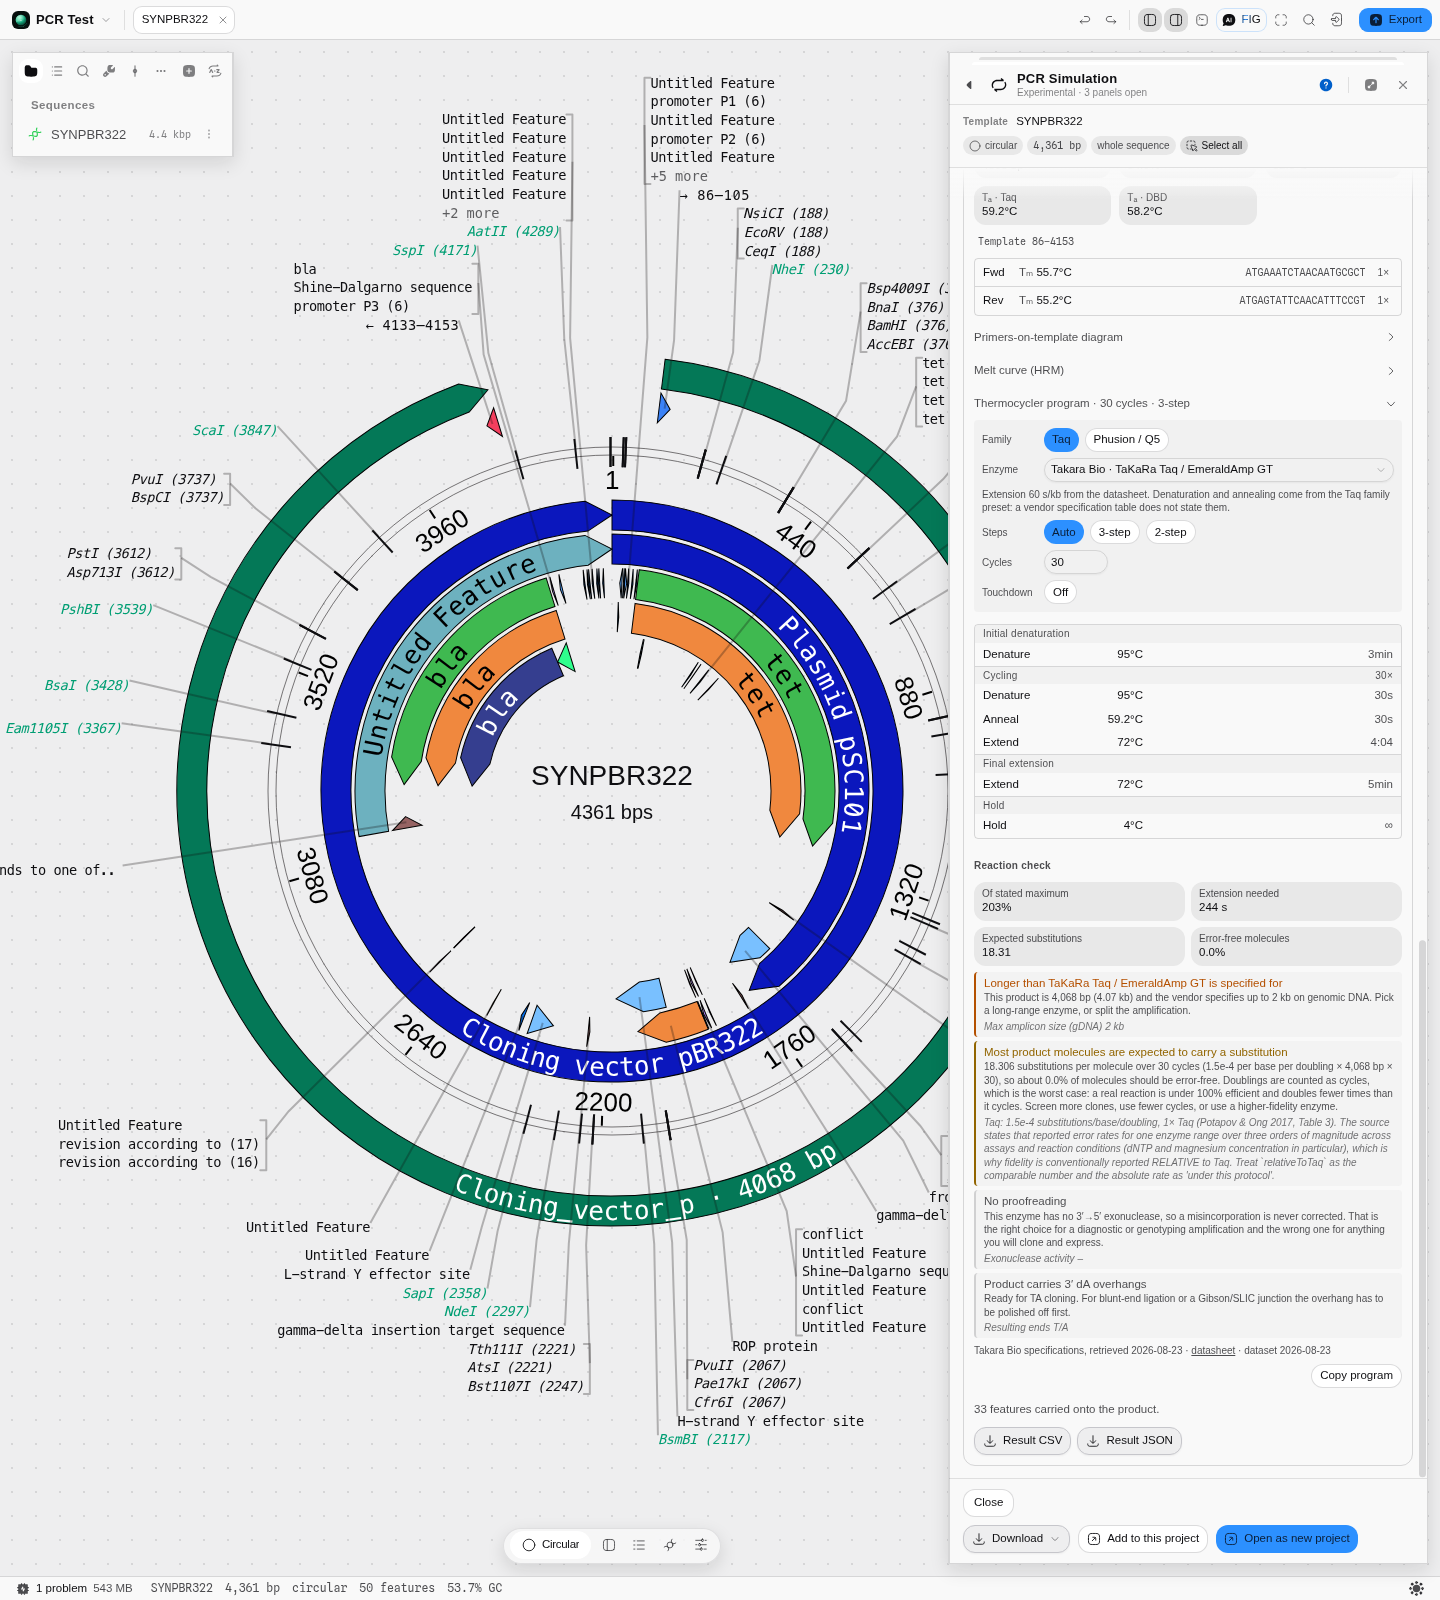 A refusal that names the number it is refusing against, and what to do instead.
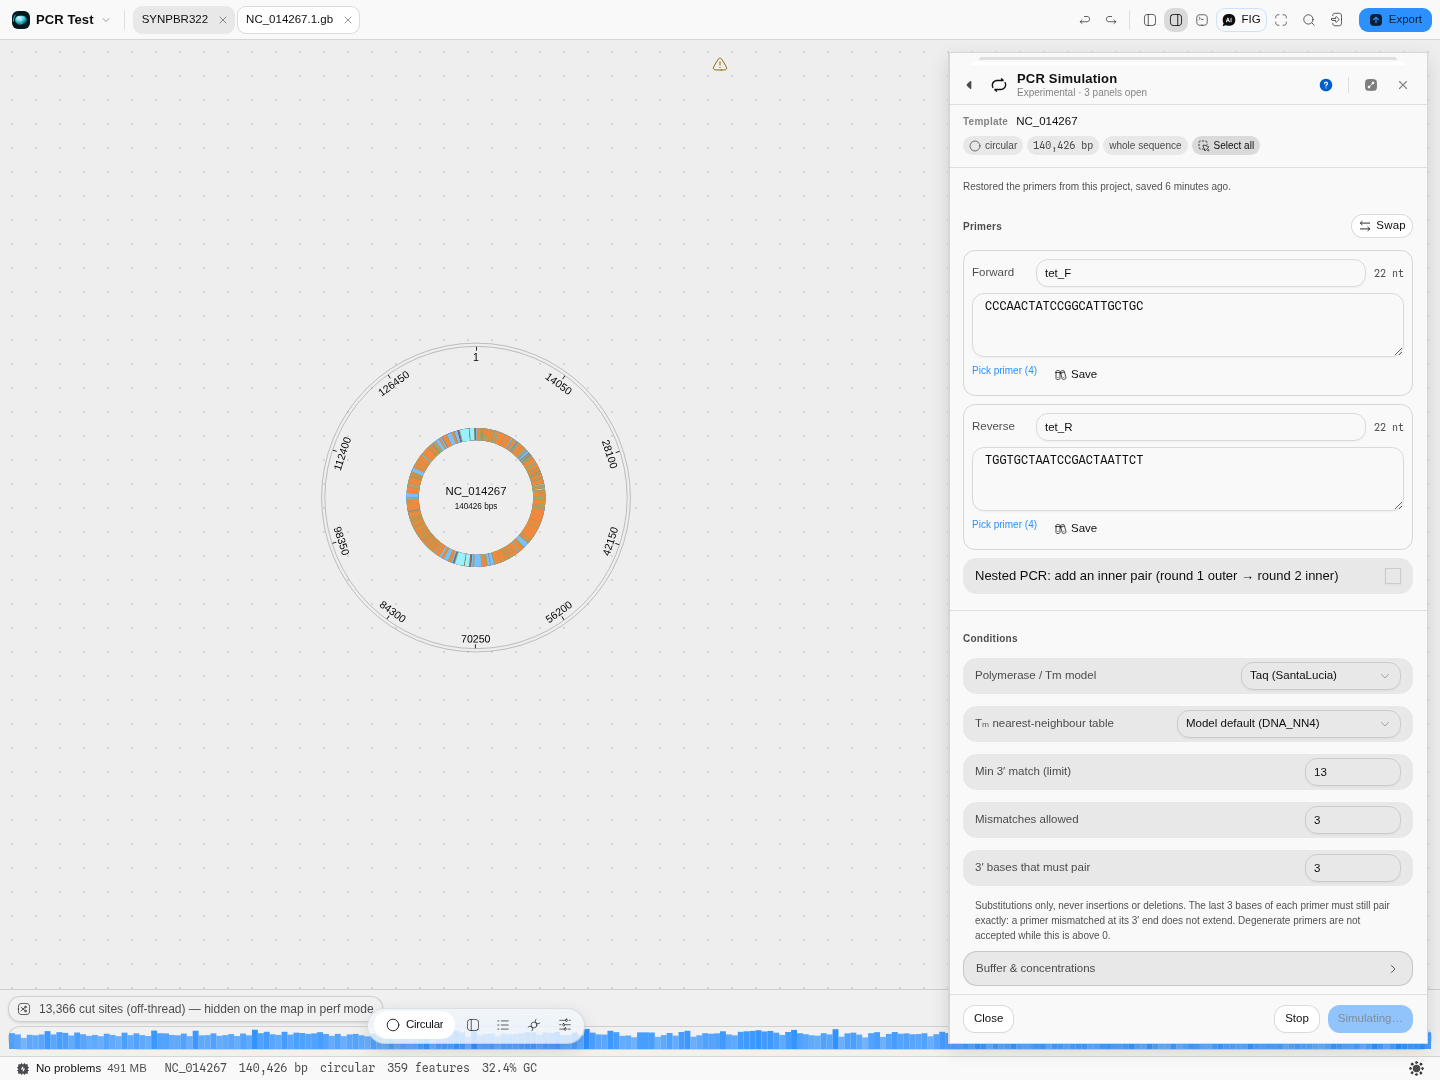 Above 100 kb the run moves off the main thread and can be stopped.
Related
Feeds it: Primer Designer designs the pair, and Primer Library stores the oligos you already have. Follows it: Digest & Gel for the bands, Fusion PCR to join two amplicons, and Gibson Assembly to put a product into a vector. An alternative to it: Multiplex PCR when the question is about a set of primers in one tube rather than one pair in detail.
In this group: Primer Designer · LAMP primer set · Bisulfite methylation primers · Degenerate primers from an alignment · CODEHOP hybrid primers from a protein alignment · Primer Library · Fusion PCR · Multiplex PCR · qPCR Design · Digital PCR · Amplification Curves → Cq · Melt Curves → Tm · Droplet gating → concentration · Droplet classification · Melting Temperature