
Nearest-neighbor distances
For each barcode, how far away its closest rival is — the plot that names the weak links rather than counting them.
What it does
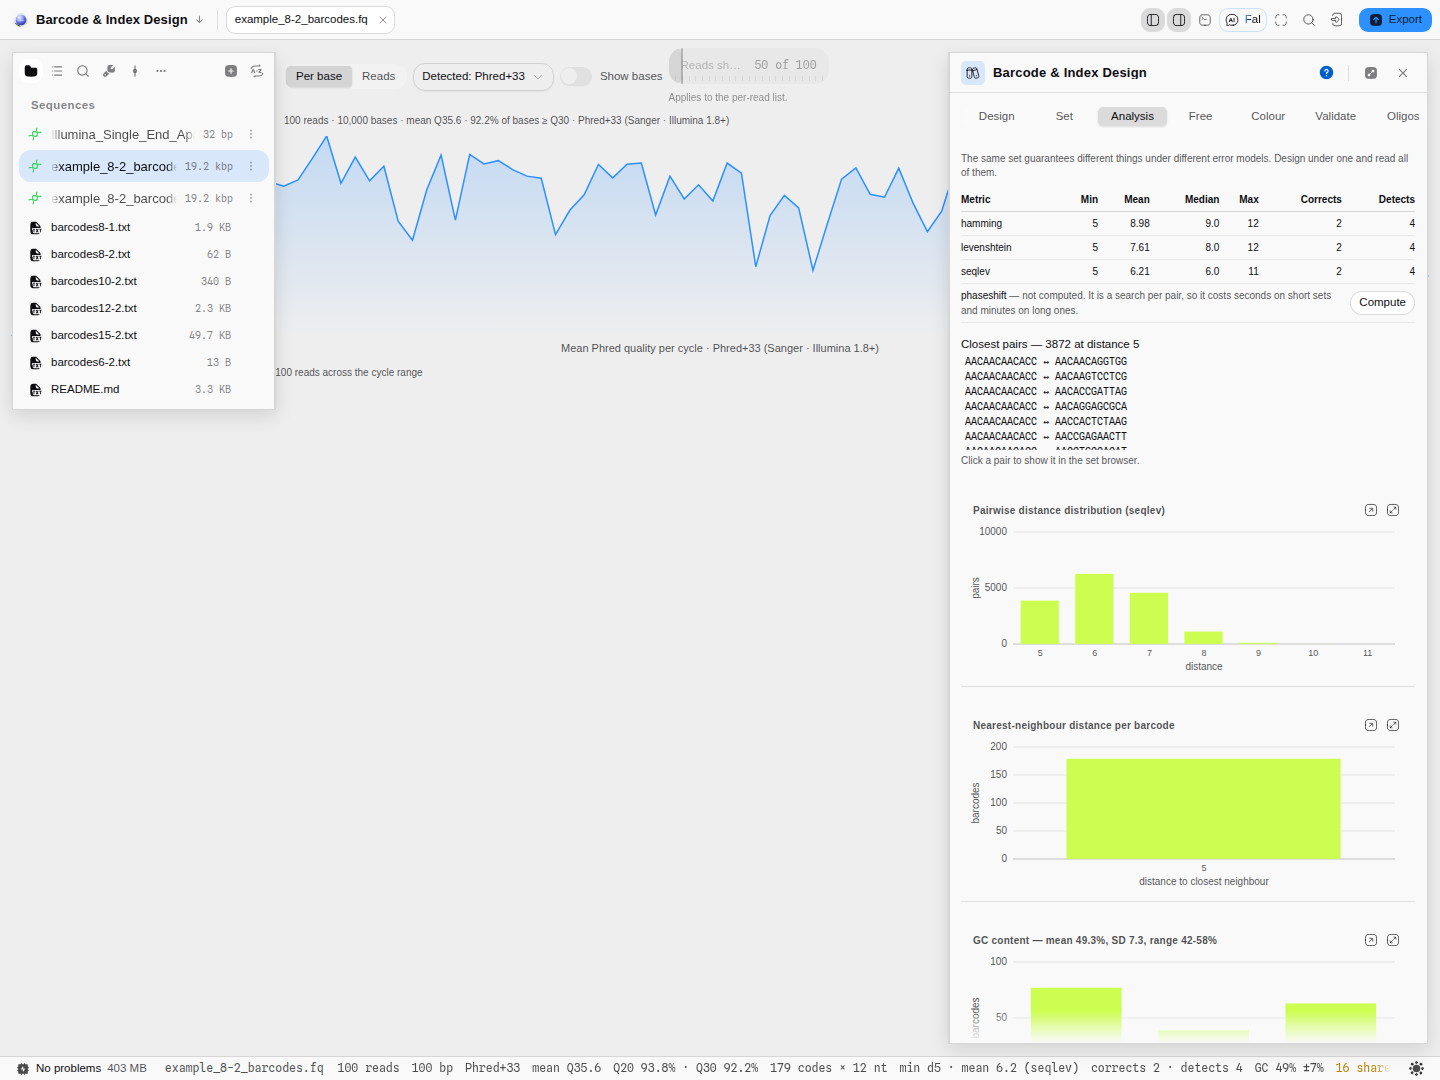
The pairwise distribution beside this one counts pairs. This one counts barcodes: for every member of the set it finds the closest other member, and bins the set by that distance. A bar at distance 3 means "this many barcodes have something else in the set only three errors away".
That is the number a demultiplexer actually lives with. A read that drifts off one barcode lands on its nearest neighbour first, so a barcode whose nearest neighbour is far away is safe even in a set whose overall minimum is low, and a barcode sitting on the left bar is the one that will collect misassigned reads.
The bars are clickable. Clicking one sends exactly those barcodes to the set browser with the reason recorded — "barcodes whose closest neighbour is 3 away" — so the plot is a way of selecting the problem members, not only of counting them. That works from the floating copy too.
When you'd use this
- Finding what to fix. The leftmost bar is the shortlist. Click it, look at the members in the set browser, and edit or drop them; the histogram redraws as you go.
- Deciding whether a set degrades gracefully. A set where every barcode's nearest neighbour is at the minimum is uniformly tight. A set with three members on the floor and the rest comfortable is three edits from a better guarantee.
- Auditing a kit you did not design. Vendor index sets are usually fine as a whole and can still contain a handful of close pairs, especially if you are using a subset of the plate.
- Choosing which barcodes to use when you need fewer than the set has. Drop the left bar's members first and the guarantee of what remains goes up.
What this computes
- Every barcode's nearest-neighbour distance under the active metric, from the full pairwise matrix computed once and read symmetrically — not an approximation and not a sample
- The identity of every neighbour at that distance, with ties kept: a barcode with three rivals at the same distance lists all three, because which one a read lands on is not decided by the distance alone
- One bar per distance value, carrying the number of barcodes whose closest rival sits there, each bar acting as a selection into the set browser
Distances are the four DNABarcodes metrics (Buschmann, Bioinformatics 33(6)
–922, 2017) — Hamming, Levenshtein, sequence-Levenshtein and phaseshift — checked against that package byte for byte.Why this exists beside the pairwise histogram: the set-level minimum answers how many errors can this set correct, a property of the whole set. The nearest-neighbour distance answers which barcode is the liability, a property of one member, and no set-level number can be decomposed back into it.
A set of one has no neighbours, and that is stated rather than drawn as an empty chart.
Where it lives
The Analysis tab of the Barcode & Index Design panel, directly below the pairwise distribution. Its section header carries a detach control that opens it as a floating surface, which keeps the click-through: selecting a bar in the floating plot still drives the set browser in the rail.
Inputs and outputs
In: the panel's working set, under the active metric.
Out: one bar per nearest-neighbour distance, each carrying the number of barcodes at that distance, and each acting as a selection into the set browser.
Every barcode's nearest-neighbour distance and the identity of every neighbour at that distance are also columns in the set browser, so what the plot shows in aggregate can be read per row. A set of one has no neighbours, and that is stated rather than drawn as an empty chart.
Screenshots
Controls
| Control | What it changes |
|---|---|
| Metric (panel-level) | The distance definition. The nearest neighbour of a barcode is not always the same barcode under Hamming as under sequence-Levenshtein. |
| Click a bar | Sends those barcodes to the set browser as a focused subset, with the reason shown. |
| The working set | Editing, adding or removing a barcode re-derives every nearest neighbour. |
| Detach | Floats the plot; click-through is preserved. |
The science
The nearest-neighbour search is the full pairwise matrix, computed once and read symmetrically — not an approximation and not a sample. Ties are kept: a barcode with three rivals at the same distance lists all three, because which one a read lands on is not decided by the distance alone.
The distance definitions are the four DNABarcodes metrics (Buschmann, Bioinformatics 33(6)
–922, 2017) — Hamming, Levenshtein, sequence-Levenshtein and phaseshift — and are checked against that package byte for byte.Why this plot exists alongside the pairwise one: the set-level minimum answers "how many errors can this set correct", which is a property of the whole set. The nearest-neighbour distance answers "which barcode is the liability", which is a property of one member, and no set-level number can be decomposed back into it.
Limitations
- Distance is not risk. Two barcodes three apart are a real hazard only if the errors your chemistry makes are the errors that metric counts. Choose the metric to match the platform before reading the shape.
- It says how far, not in which direction. For the specific rivals of a specific barcode, read the neighbour column in the set browser, or the closest-pairs list above the plots.
- A set of one, or a set with duplicates, is a degenerate case — duplicates sit at distance zero and are flagged in the set browser rather than being quietly plotted.
Related
In this group: Edit annotation · Enzyme · Insert sequence · Merge features · Manage enzymes · Dot plot · Dot plot grid · Melt curve · Amplification curves · Population genetics · RNA-seq · Site avoidance heat map · Protein coverage · Reference-gene stability · Digital PCR · Codon usage matrix · Pairwise distance distribution · GC content distribution · Base composition per cycle · Pairwise distance grid · Per-cycle channel occupancy · Grammar assembly plan · Gibson assembly plan · Assembly plan build order · Golden Gate assembly plan · Guide track · Primer binding track · Hydropathy profile · Charge vs pH · Amino-acid composition · Hydrophobic moment · Optimization profiles · Digest gel · Virtual gel · Initiation-window fold · Antibody domain map · Electropherogram · Circuit netlist · Circuit transfer functions · Circuit construct · Construction graph · Protocol · Read Quality Profile · Read Alignment · Raw Signal · Verify vs Reference · Chromosomal microarray · Variant calls · Small molecule
Pairwise distance distribution
Every pair of barcodes in the set, counted by how far apart they are — the shape behind the single minimum-distance number.
GC content distribution
How GC content is spread across the barcode set, binned to whole percent, with the mean, spread and range on the section header.