
Domain architecture
| Document kind | domains |
| Drawn from | a tool result — there is no file behind it |
What it draws
A protein drawn as a horizontal axis of residues, with every domain call laid on top of it.
Each lane is one member database — Pfam, Gene3D, SUPERFAMILY, CDD, PANTHER, SMART, PROSITE and the rest — and each box in that lane is one thing that database found, positioned and scaled to the residues it covers. A thin backbone runs the full length of every lane, so a box that covers a third of the protein looks like a third of the protein.
The picture answers a question a table of coordinates cannot: what shape is this protein? A two-domain enzyme, a membrane protein with a periplasmic loop, a long disordered tail with one folded head — all of them are recognisable at a glance here and laborious to reconstruct from rows.
What opens in it
Nothing on disk. This canvas is drawn from a domain scan result, so it appears once a protein has been scanned and disappears when that result is cleared. It has no file format of its own: the underlying result can be exported in the scanning service's own formats, but the diagram is a view of a result, not a document you can open.
If you are looking for a picture of a sequence file, you want the circular, linear or sequence map instead. The domains also appear there — the same calls, at DNA coordinates, on the molecule itself.
What this computes
The domain calls themselves are made by the scanning service and its member databases; this canvas computes the architecture they add up to, which is the thing a table of coordinates cannot show.
- Residue-space geometry. Every box is positioned and scaled to the residues it covers, against a backbone drawn at the protein's full length — so a domain covering a third of the protein looks like a third of the protein. The axis is residues, not bases, 1-based and inclusive; the same calls drawn on the sequence map are at DNA coordinates, so the two sets of numbers legitimately differ by a factor of three plus the offset of the coding sequence.
- One lane per member database, kept separate on purpose. When Pfam, Gene3D and SUPERFAMILY all call the same region you are seeing three independent models agree, which is information; merging them into one row would manufacture an agreement the data does not state and hide a disagreement when there is one.
- Discontinuous domains drawn as their real pieces. A domain interrupted by another is drawn as separate boxes with the gap between them, never as one bar spanning the whole envelope — the envelope would claim residues the domain does not occupy.
- Lane packing, so overlapping calls within one database remain individually readable rather than being drawn on top of each other.
No score is encoded in the drawing. Box position and extent are the claim; the E-value, the bit score and the signature that produced each call are in the result beside it.
Reading it
The axis is residues, not bases. Numbers along the top are amino-acid positions in the protein, 1-based and inclusive. The same domains drawn on the sequence map are at DNA coordinates, so the two sets of numbers are legitimately different by a factor of three plus the offset of the coding sequence. Neither is wrong; check which axis you are reading before comparing them.
Lanes are opinions, not a consensus. Databases are stacked separately on purpose. When Pfam, Gene3D and SUPERFAMILY all call the same region, you are seeing three independent models agree — which is information. Merging them into one row would manufacture an agreement the data does not state, and would hide a disagreement when there is one.
A gap in a lane is real. A domain that is interrupted by another one is drawn as separate
pieces with empty space between them, never as one bar spanning the whole envelope. Yeast alcohol
dehydrogenase is the standard example: its zinc-binding catalytic domain occupies residues 21–153
and 296–341, and the Rossmann NAD(P)-binding fold sits inside that interruption at 154–295. Drawing
the catalytic domain as a single bar from 21 to 341 would claim it covers residues that belong to a
different fold, so the diagram does not do it. The tooltip on such a box says which piece it is
(piece 1 of 2).
Shading carries the kind of feature, not its strength. Sites and domains are drawn solid; families, repeats and coiled coils progressively lighter; intrinsically disordered regions faintest of all. The intent is that a strong structural claim reads as a strong mark and a low-information region reads as a wash. It is never a confidence score — the E-value in the panel's table is where confidence lives.
Boxes are clipped to the protein. A model whose match runs off either end is drawn to the end of the axis rather than off it.
Controls
The diagram itself has no controls; it draws whatever the panel's filters currently show, which is what makes it useful as a live readout:
- Narrowing by E-value, by InterPro-integrated only, or by library removes those boxes from the diagram as well as the table.
- Turning on Representative only collapses the picture to the service's own condensed reading — on the ADH example, twelve matches become two, and the diagram shrinks from eight lanes to two.
- Clicking a box selects that domain on the sequence, which is the diagram's hand-off: you point at a shape and the corresponding codons are selected on the molecule, ready to cut, copy or hand to another tool. Keyboard users can tab to a box and press Enter for the same result.
- Hovering a box gives the full readout: the entry name, the member database and its accession, the residue range, the kind of feature, and which piece it is when a domain is discontinuous.
Where it appears
Beneath the scan result in the Protein Domains panel, sized to the panel's width. It is a readout, not a stage document, so it travels with the panel: narrow the rail and it compresses with everything else rather than scrolling sideways.
Performance and limits
The diagram is one small vector drawing — a lane per member database and a box per piece — so it costs nothing to redraw and has no size gate. The practical limit is legibility rather than speed: a protein matched by many databases stacks many lanes, and a very short match on a very long protein is drawn at a minimum visible width so that it cannot vanish entirely. Database names longer than the label column are truncated with an ellipsis; the tooltip always carries the full name.
Screenshots
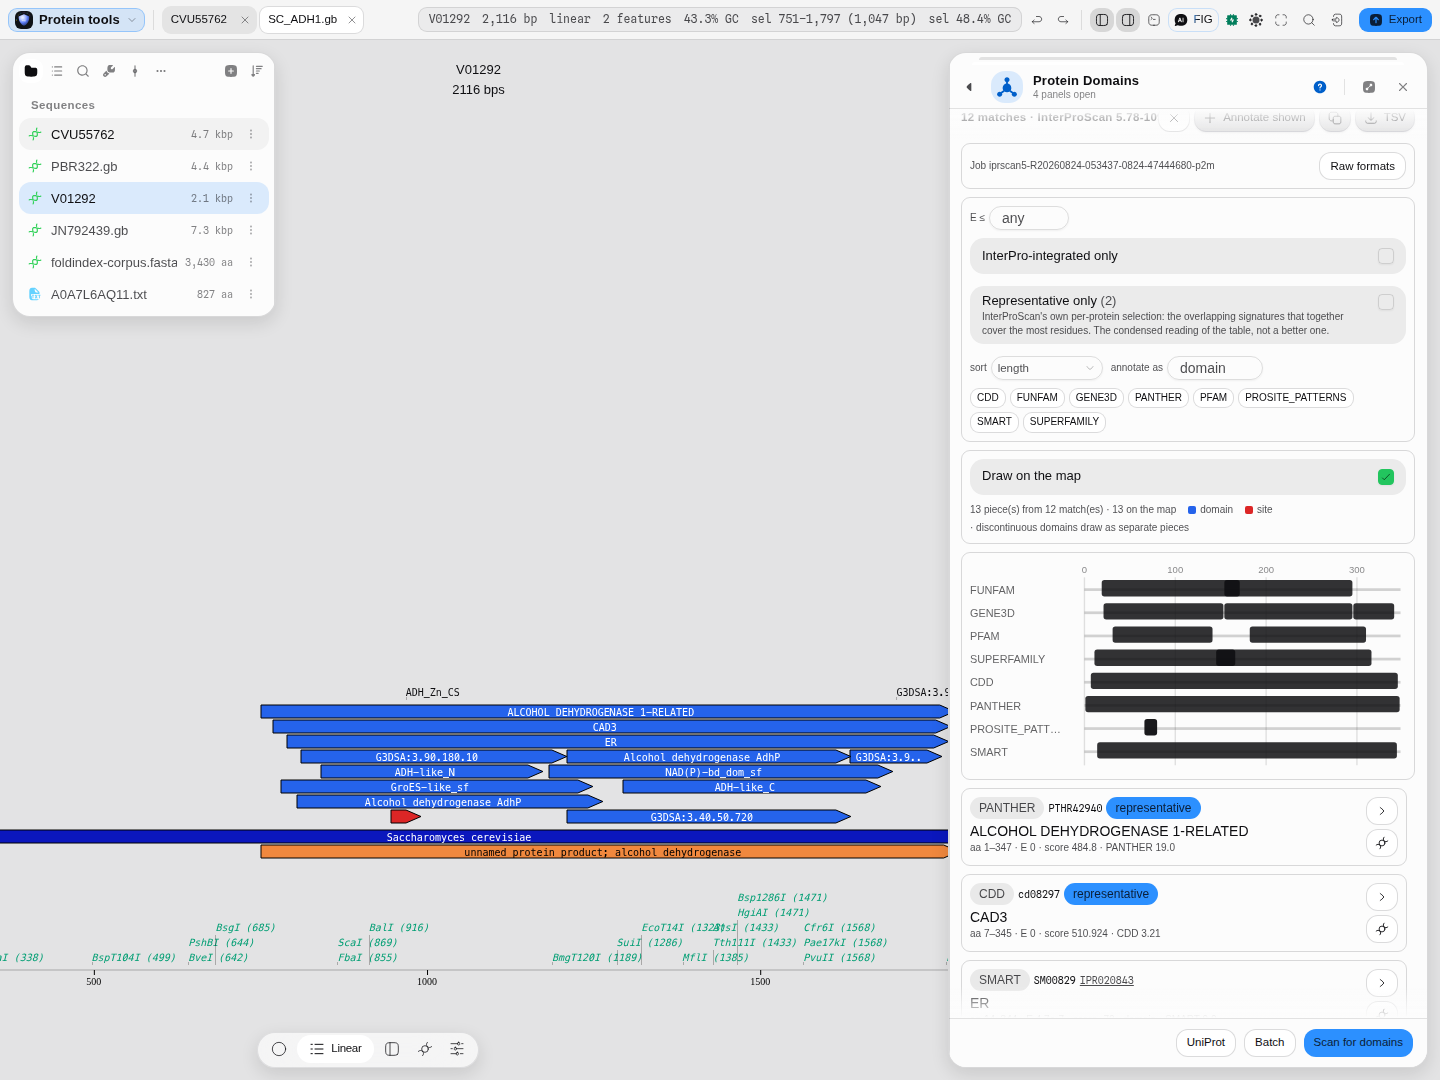 Eight member databases over 348 residues. The Gene3D lane shows the two-piece catalytic domain with
the Rossmann fold in the interruption; the PROSITE lane is the short zinc-binding signature at aa
66–80, which is what a 15-residue match looks like at this scale.
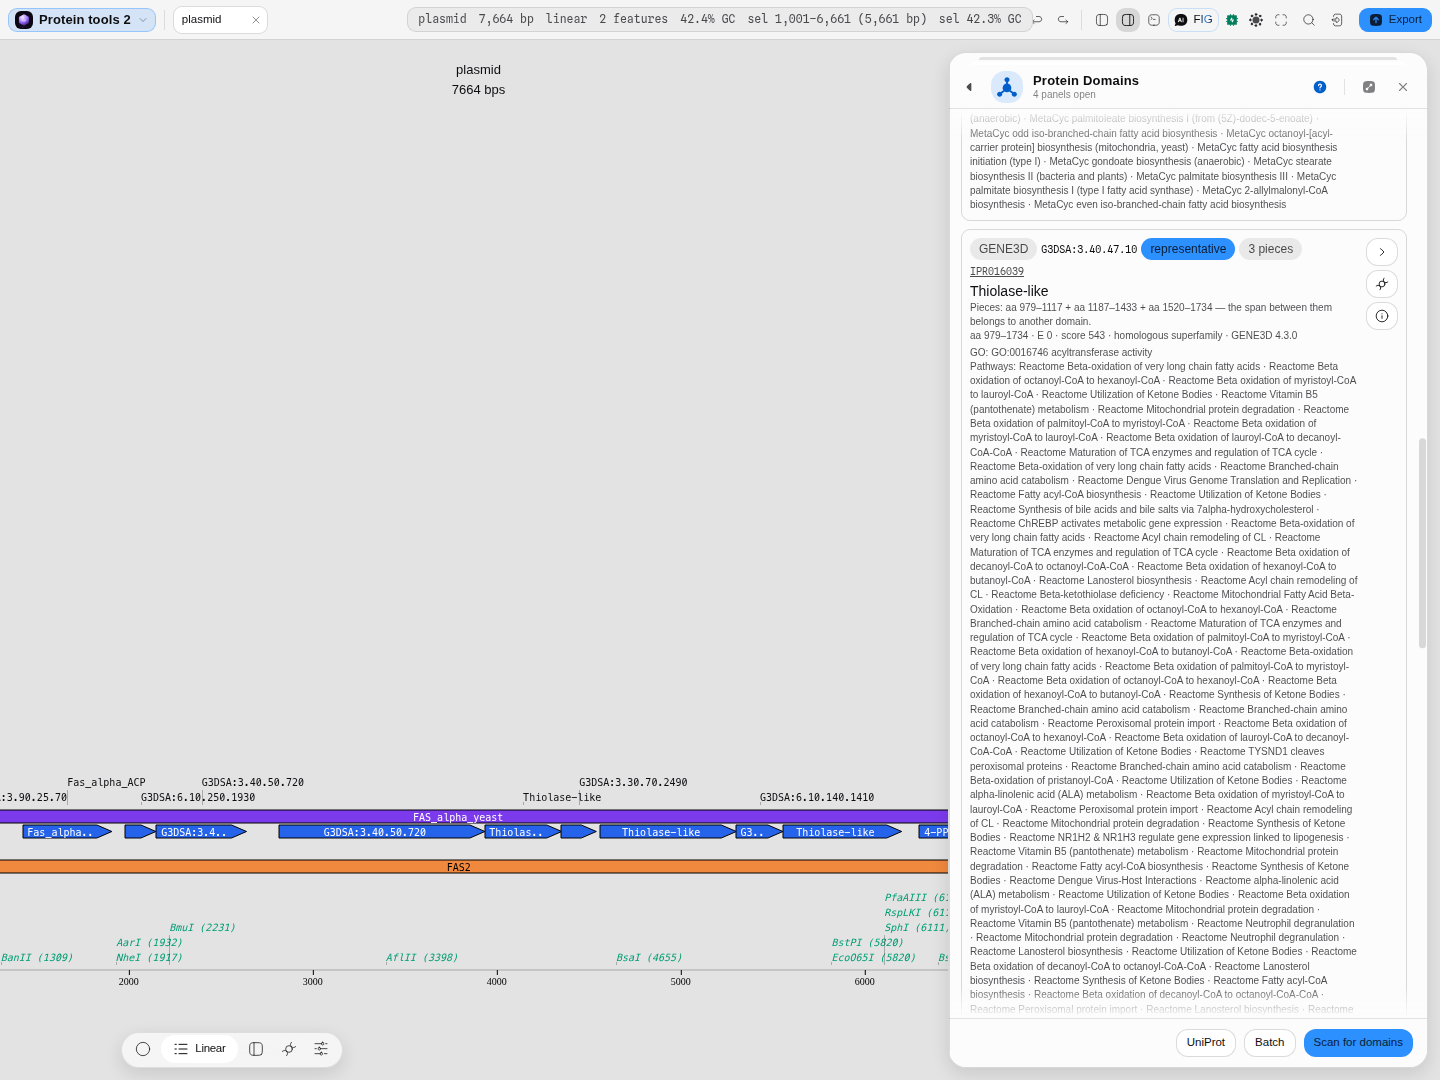 Yeast FAS2 with Representative only switched on —
9 of 38 locations shown, and the diagram, the
map track and the table all follow that one filter. The row is GENE3D G3DSA:3.40.47.10, badged
3 pieces: Thiolase-like, reported over aa 979–1734 but occupying 979–1117 + 1187–1433 +
1520–1734, with the panel saying why in words — "the span between them belongs to another domain".
This is the discontinuous case the canvas draws as separate boxes rather than one wrong span.
Related
Written by: Protein Domains.
Reads onward to: the circular, linear and sequence maps, which draw the same calls at DNA coordinates on the molecule, and Protein Analysis, whose profile plots share the same residue axis.